UAA Bullish Above $20.80, Stop $20.30 Price Action Bullish Morning Star T-Line Regression
Subscribe to my youtube Channel for free education
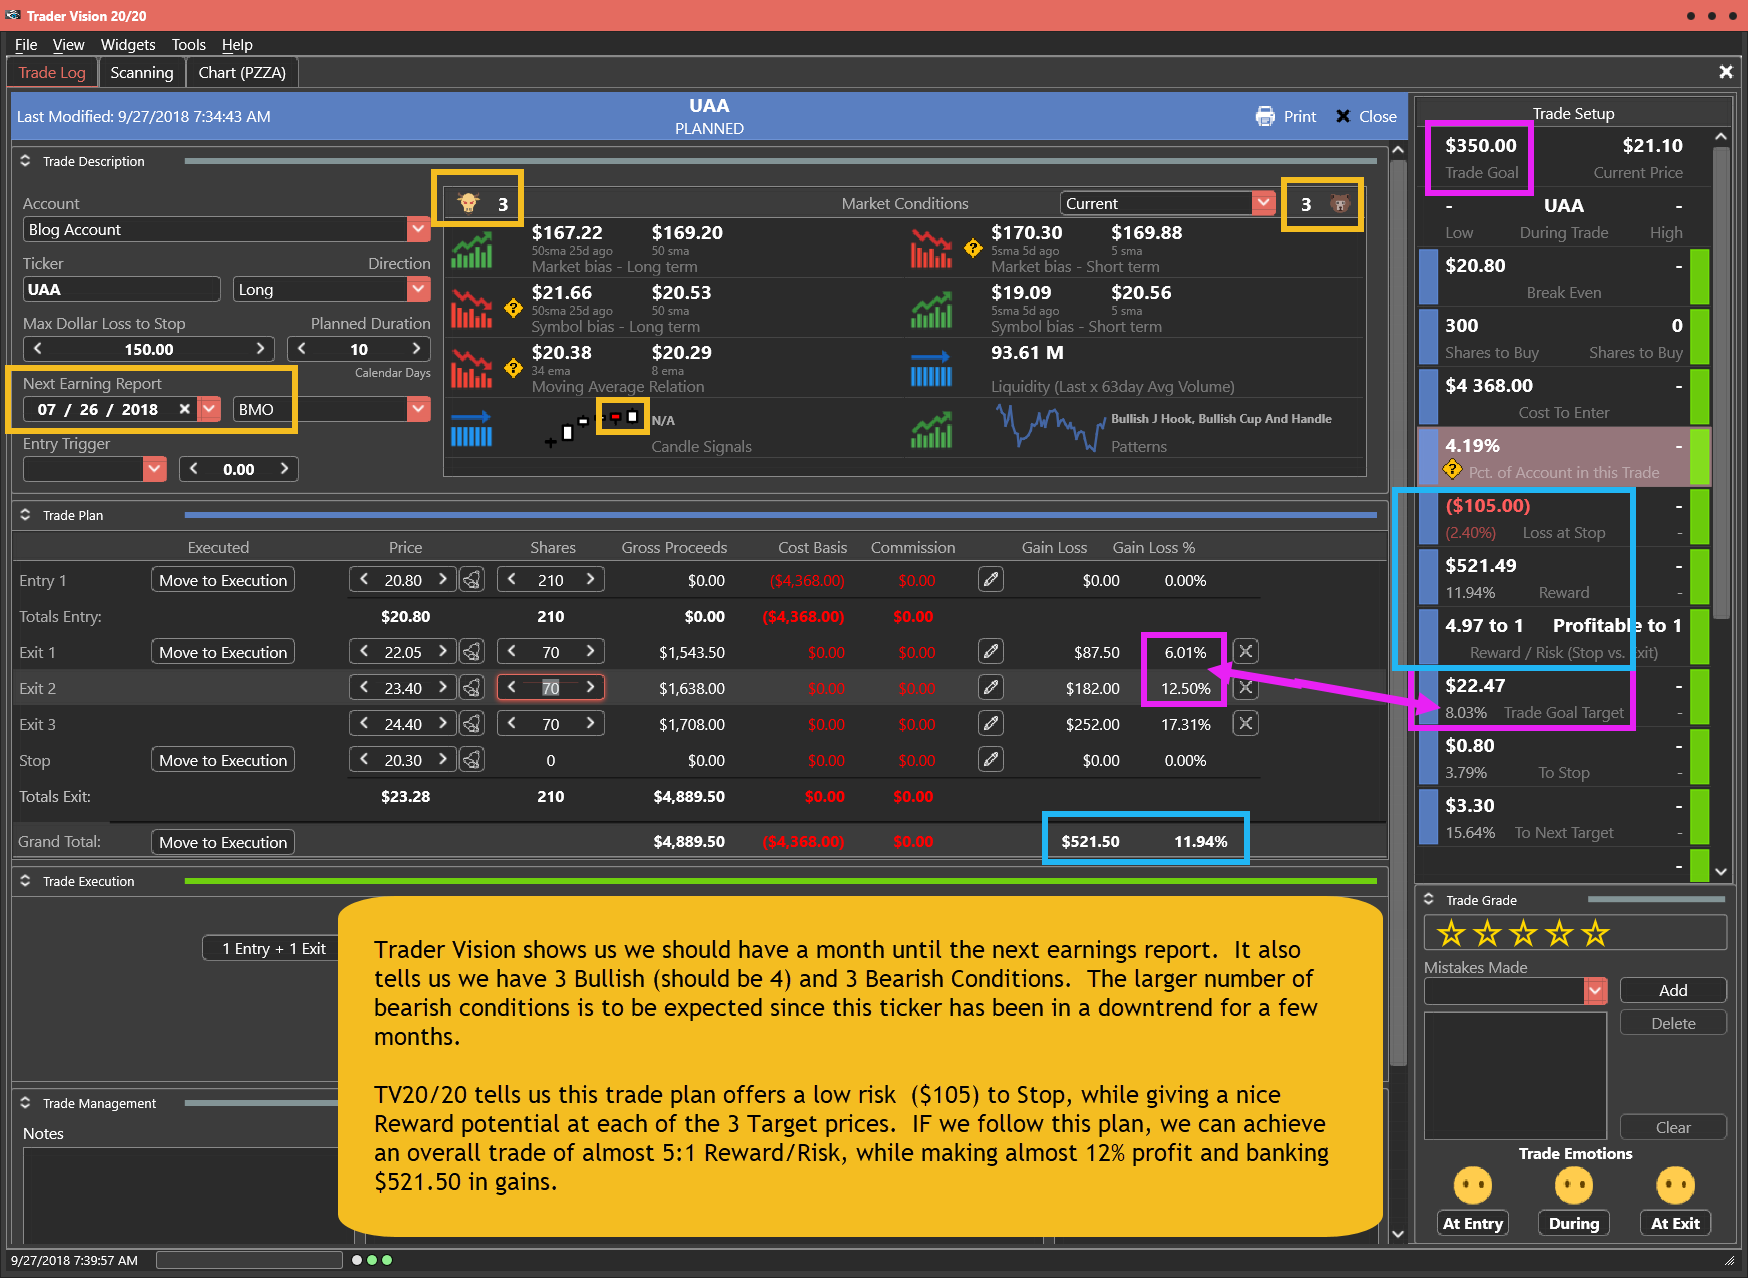
UAA Bullish Above $20.80, Stop $20.30
UAA bullish above $20.80, Stop Near $20.30 UAA daily chart price action – Bullish Morning Star, pop over the T-Line Regression Lines and five a month downtrend line breakout, support and rest with a Billish Engulf yesterday. UAA weekly chart price action – (RBB) Rounded Bottom Breakout, test the Dotted Duece, PBO to the 50-SMA, Bullish Engulf with Doji Continuation over the downtrend line. UAA is looking like a 16% stock trade to the June highs with profit zones along the way. The option trade could be in the 80-100% area.
[images style=”0″ image=”http%3A%2F%2Fhitandruncandlesticks.com%2Fwp-content%2Fuploads%2F2018%2F09%2FRBB-Click-Here.png” width=”939″ link_url=”https%3A%2F%2Fob124-10cd91.pages.infusionsoft.net%2F” align=”center” top_margin=”0″ full_width=”Y”]
“Base Hits Wins The Game”
Past performance is not indicative of future returns
Good Trading, Rick, and Trading Team
____________________________________________________________
SPY
The SPY tested our Lower T-Line Regression Line yesterday and held only by skin. The V-Stop and price action is suggesting we see a bit more weakness. Too much weakness and we could see the $288.15 and $286.40 areas which would be a test of the January highs.
****VXX – Tuesday the VXX painted a Bullish Engulf and yesterday the paint continued with bullish follow through. At this rate, we might see price action reach for the T-Line Regression Lines, over the green one and we better buckle up.
Focus Trading Education
Candlesticks • Price Action • T-Line • T-Line Bands • Support • Resistance • Trend • Trendlines • Chart Patterns • Buy Box • Volatility Stops • Profit Zones • Entry Zones • Protective Stops • RBB Rounded Bottom Breakout Strategy • Pop Out of The Box Strategy • Pinball Strategy • Trade Planning, Fibonacci, Stoch/RSI
Subscription Plans • Private 2-Hour Coaching
Testimonial
This is not your usual service that sends out a ton of stock recommendations, and then cherry picks the winners to show you how great they are. Hit and Run Candlesticks and Right Way Options are truly educational services. They taught me how to trade not what to trade. The entire team: Rick, Doug, Steve, and Ed are there to help and answer your questions. They are awesome. They cut years off my learning curve. And it’s a team effort. Everyone in the room (all the members) are there to help with invaluable insights and advice. The only service you will ever need. Thanks to all the team for how you have helped me and for all you do. –Jonathan Bolnick
Rare to have a service teach you how they find their choices but, HRC/RWO teach you how to fish instead of fishing for you. And, your ideas are not panned but shared, implemented, or improved. Sharing is caring. –Thomas Bradly
Past performance is not indicative of future returns
Investing and Trading involve significant financial risk and is not suitable for everyone. No communication from Hit and Run Candlesticks Inc, Right Way Option, Trader Vision 2020, Top Gun Futures or Rick Saddler, Doug Campbell, Ed Carter, Steve Risner is to be considered financial or trading advice. All information is intended for Educational Purposes Only. Terms of Service.
Rick Saddler, Doug Campbell, Ed Carter, Steve Risner is not a licensed financial adviser nor do they offer trade recommendations or advice to anyone.
 The market experienced the typical price gyrations after the Fed put all its card on the table yesterday afternoon. Sellers were expressing their disappointment at the close, but this morning the Futures are trying to open the day positive. With several market-moving reports before the open anything is possible and swing traders may still find it difficult to find an edge this morning.