Swing Traders Love Rest and Rallies OPB Bullish over $3.38 • Stop near 3.25

Swing Traders Love Rest and Rallies

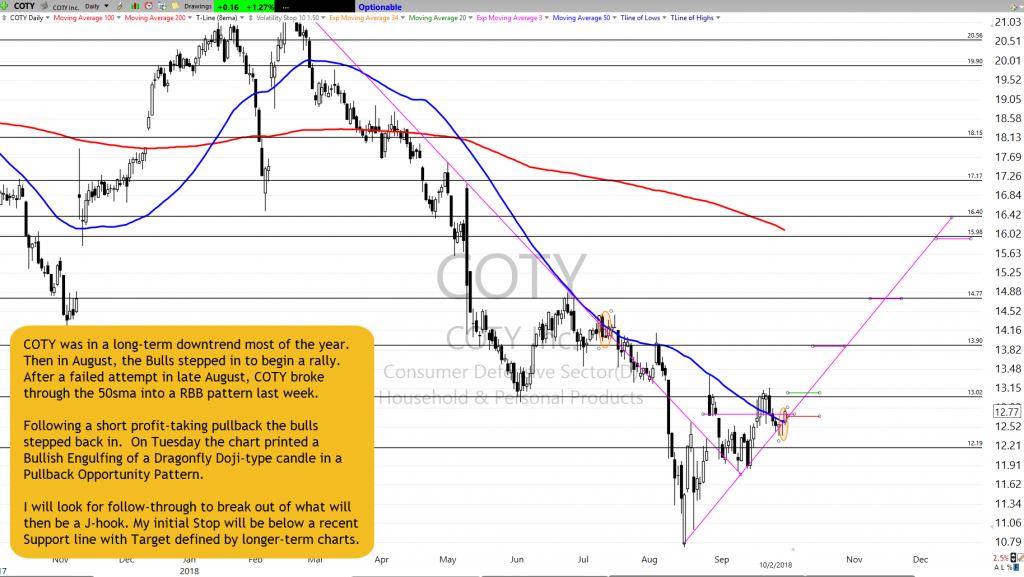
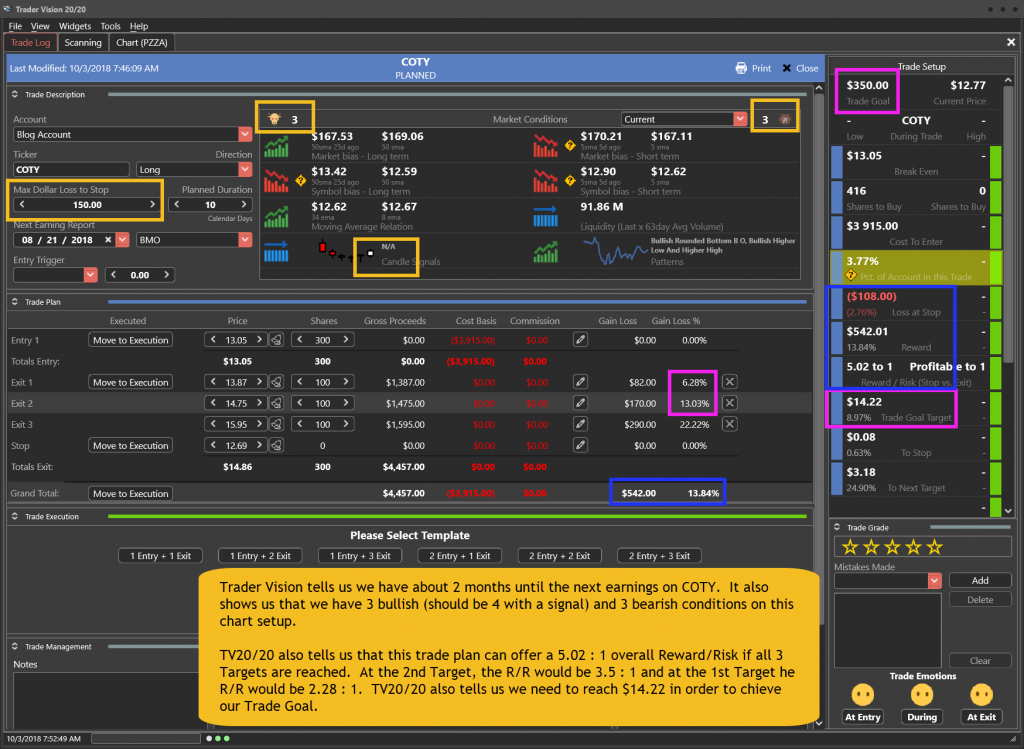
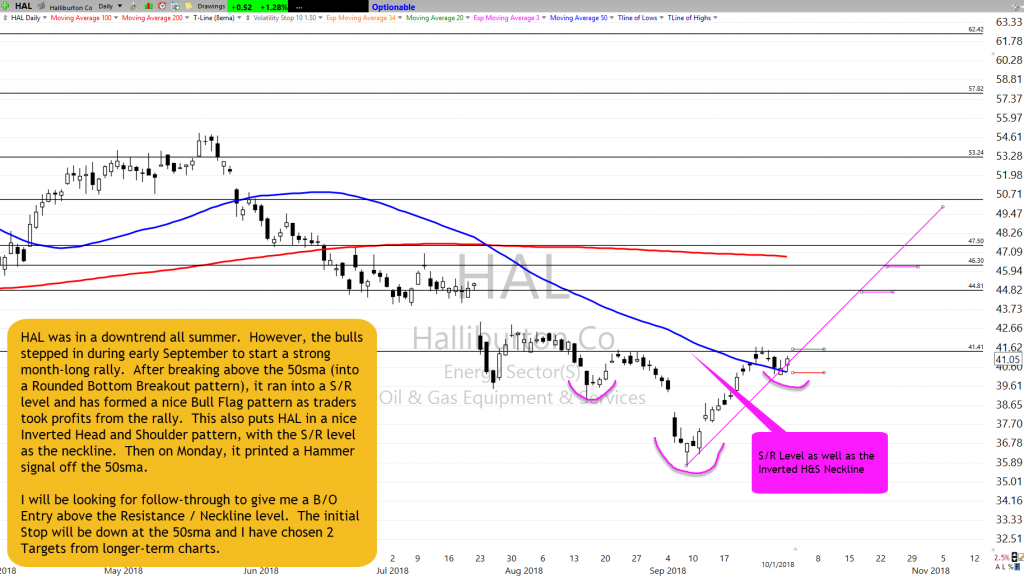
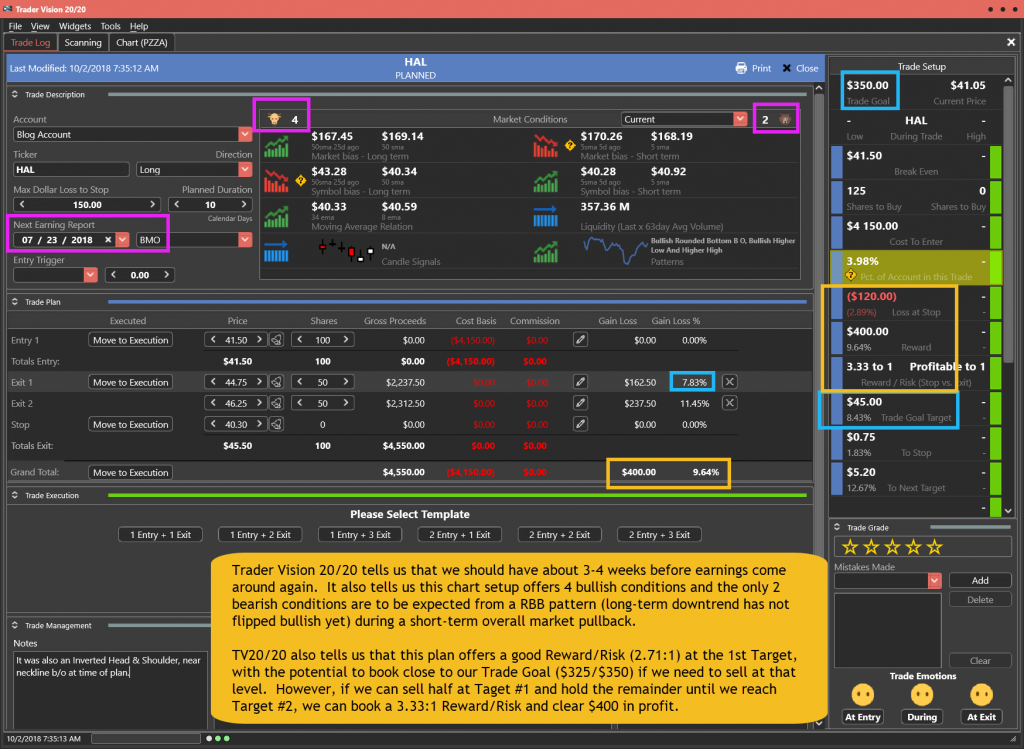
In the past 20-days, Swing Traders have drawn two rest and rally patterns on the ODP canvas. We are currently in a rest period with a Doji and Bullish Engulf using the T-Line and multiple touches of $3.25 for support. The weekly chart is in a Rounded Bottom Breakout pattern/Strategy coming out of a little Cup and Handle pattern. It looks like the price action has its eye on a Swing Trade to about the 4.00 level with a couple of profit stops along the way. A Stop about 3.25 would keep the risk in check for us. More details see TV20/20 Blog

Past performance is not indicative of future returns

Good Trading, Rick, and Trading Team

This link takes you to a project account that Rick started so members and students could see how it works Monthly Trading Results updated the first week of each month.

What’s on Rick’s watchlist today? A 246% plus increase in 7 months can’t be all wrong.


____________________________________________________________

SPY •

Friday the SPY closed resting on the T-Line looking ready to do its job and climb higher. This morning the features are not totally in agreement with that plan. Today the Bull would like to see price action hold over the T-Line, build sup[port and prepare to challenge the August high. The bear would like to see a close below the T-Line so price action can challenge the $285.80 area. Right now we are in a state of “rest and test.” Price action rest while the bulls and bears fight an internal battle.

T-Line • Traders Best Friend

Last Friday was a 12-day T-Line run, will today be 13? Sorry, we’re all having to wait for the 4: PM bell for the final decision. We should have a few clues as the day moves on. As a rule of thumb the price action that controls the T-Line controls the direction.

****VXX – Thursday last wee price closd=ed over the T-Line and Friday closed back below the T-Line. Pre-market today has it back above…so far.

Focus Trading Education

Candlesticks • Price Action • T-Line • T-Line Bands • Support • Resistance • Trend • Trendlines • Chart Patterns • Buy Box • Volatility Stops • Profit Zones • Entry Zones • Protective Stops • RBB Rounded Bottom Breakout Strategy • Pop Out of The Box Strategy • Pinball Strategy • Trade Planning, Fibonacci, Stoch/RSI

Subscription PlansPrivate 2-Hour Coaching

Testimonial

This is not your usual service that sends out a ton of stock recommendations, and then cherry picks the winners to show you how great they are. Hit and Run Candlesticks and Right Way Options are truly educational services. They taught me how to trade not what to trade. The entire team: Rick, Doug, Steve, and Ed are there to help and answer your questions. They are awesome. They cut years off my learning curve. And it’s a team effort. Everyone in the room (all the members) are there to help with invaluable insights and advice. The only service you will ever need. Thanks to all the team for how you have helped me and for all you do. –Jonathan Bolnick

Rare to have a service teach you how they find their choices but, HRC/RWO teach you how to fish instead of fishing for you. And, your ideas are not panned but shared, implemented, or improved. Sharing is caring. –Thomas Bradly


Past performance is not indicative of future returns

Investing and Trading involve significant financial risk and is not suitable for everyone. No communication from Hit and Run Candlesticks Inc, Right Way Option, Trader Vision 2020, Top Gun Futures or Rick Saddler, Doug Campbell, Ed Carter, Steve Risner is to be considered financial or trading advice. All information is intended for Educational Purposes Only. Terms of Service.

Rick Saddler, Doug Campbell, Ed Carter, Steve Risner is not a licensed financial adviser nor do they offer trade recommendations or advice to anyone.


Challenging Clues

Challenging Clues

A new record high in Russell and indecisiveness in the DIA and SPY certainly makes for challenging clues as to what happens next.  On the positive side, all the indexes are trending, and the bulls have shown tremendous strength with the hope of wrapping up trade negotiations with Mexico and Canada.  On the negative side, the threat of 200 billion in new tariffs against China looms heavy, and the bears have started looking for weakness with some minor attacks.

Couple that with the possibility of light volume due to extended labor day vacations and the phrase, “anything is possible,” seems to be an understatement.  The futures are pointing to a lower open, but I wouldn’t expect the bulls to give up easily.  Remember a pullback to test support within a trending market is a normal and healthy thing as long as support levels hold.

On the Calendar

Our short week begins with three potential market-moving reports on the Economic Calendar.  First, at 9:45 AM the PMI Manufacturing Index according to consensus will see a slightly decline to 54.5 in August vs. 55.5 in July.  At 10:00 AM, the ISM Mfg. Index is also expected to decline slightly to 57.6 vs. 58.1 giving some relief to backlogs and delivery delays.  Also at 10:00 AM, the volatile Construction Spending is expected to increase in July by 0.4% while continuing to experience labor shortages and higher material costs.  Other than that we have 3-Bond Auctions between 11:30 AM and 1:00 PM to round out the day.

On the Earnings Calendar, we have just over 30 companies reporting results today.  Before the bell, CONN, CASY and SHLD are among those reporting.    After the close COUP, WDAY, and RH are among those stepping up to report.

Action Plan

Friday’s choppy price action shook off the morning selling with a late day rally producing a new record high close for the Russell.  The QQQ stop just short of making a new record while the DIA and SPY left behind candles of indecision.  Asian market was mostly higher overnight although the Chinese economy continues to produce worrisome data points.  Currently, European markets are decidedly lower this morning as the threat of 200 billion in new US tariffs looms over China.

The Bulls have been solidly in control, but this morning the Futures markets are indicating a gap down open.  After such a strong run a pullback or consolidation would be healthy as long as the bulls defend support levels.  However, the bulls have been so tenacious that a rally back would not be out of the question.  Remember that many traders may have extended their holiday into this week so choppy price action and light volumes are possible.

Trade Wisely,

Doug

[button_2 color=”green” align=”center” href=”https://youtu.be/yFz9iWrItgc”]Morning Market Prep Video[/button_2]

ODP Setup and Trade Plan

Today’s Featured Trade Idea is ODP.

Members can join us in Trading Room #1 as Rick reviews the ODP setup and other Trade-Ideas at 9:10am Eastern.  For now, here are my own analysis and a potential trade plan made using our Trader Vision 20/20 software.

ODP has been in a Bullish trend since early April. After pullbacks in June and July, the Bulls resumed a strong rally throughout August (with a short consolidation for profit-taking along the way). Over the last week, ODP has taken profit again (forming a nice little Flag pattern) and then on Friday it printed a Morning Star signal.

I will look for an Entry above the highs of the last week with a Stop at Friday’s low (below Support). Targets were defined off the Weekly S/R levels and confirmed by Fib Ext. of the August Bull Run.

Trader Vision shows us that earnings are out of the way. It also tells us we have 6 Bullish conditions versus only 1 Bearish condition (the pullback last week) in the Setup.

TV20/20 then shows us that this plan will give us over 2:1 Reward/Risk at the 1st Target. However, if we can sell half at Target #1 and hold the remainder to the 2nd Target, we can achieve 3.5:1 ($500 / $143) Reward/Risk on a nice 13.46% profit trade.

Having this knowledge before a trade is even entered makes it much easier to control emotions and maintain discipline.

Below is my markup of the chart and the trade plan as laid out by Trader Vision 20/20.  As a bonus, if you click the green button below, you’ll be able to watch a video of the chart markup and trade planning process.

The ODP Trade Setup – As of 8-31-18

ODP Chart Setup as of 8-31-18

The Trade Plan

ODP Trade Plan for 9-4-18

Note how Trader Vision 20/20 does so much of the work for you.  Knowing the ratio of Bullish Conditions to Bearish ones as well as the overall risk of the position size, risk to Stop out and the Reward possible at each Target price can help a great deal with controlling our emotions.  Knowing the dollar impact of every scenario ahead of time, allows us to make calm decisions during the trade.  It really takes the pressure off.  No guesswork.  No surprises.  No emotional roller coaster.

To see a short video of this trade’s chart markup and trade planning, click the button below.


[button_2 color=”light-green” align=”center” href=”https://youtu.be/t8rkOxmrM-M” new_window=”Y”]Trade Plan Video[/button_2]

Put the power to Trader Vision 20/20 to work for you…

[button_2 color=”orange” align=”center” href=”https://hitandruncandlesticks.com/product/trader-vision-20-20-monthly-subscription2/” new_window=”Y”]TV20/20 Software[/button_2]


Testimonial

Trader Vision immediately simplified the process…immediately it provided that information and guidance to me. I knew what I would risk for how much reward, I began taking trades off at the 1st target, 2nd target, I was no longer holding all my trades for the homerun. I also began implementing the stop losses if and when they were reached, not just hoping the stock would recover.  It then became easier to see what patterns were working for me and which were not.  It provided a much more relaxed and stress-free environment. –Joan G


***************************************************************************************************

Investing and Trading involve significant financial risk and are not suitable for everyone. Ed Carter is not a licensed financial adviser nor does he offer trade recommendations or investment advice to anyone. No communication from Hit and Run Candlesticks Inc. is to be considered financial or trading advice. All information is intended for Educational Purposes Only. Terms of Service.

***************************************************************************************************

HZNP Setup and Trade Plan Be Careful - 3day Weekend Risk

Just be careful taking any new trades today.  We are going into a 3-day weekend with the market showing some weakness at all-time highs.  We also have volatility-inducing headline risk with the President threatening $200billion ins new Tariffs on China as soon as next week, but also claiming we are very close to a trade deal with Canada (who he says will be forced to sign a deal very soon).  In that environment, 3 days where you are unable to adjust trades could seem like an eternity.

That said, today’s Featured Trade Idea is HZNP.

Members can join us in Trading Room #1 as Rick reviews the HZNP setup and other Trade-Ideas at 9:10am Eastern.  For now, here are my own analysis and a potential trade plan made using our Trader Vision 20/20 software.

Bear in mind, the market is toppy at all-time highs. We also face a 3-day weekend with Intl. Trade fear and (posturing via media and Twitter). That headline risk on an already nervous market looking to maybe take profits makes ANY trade more risky now. Trade at your own risk.

That said, HZNP shows a nice setup. It’s been trending bullish since May and after a 2-week consolidation it looks like it has found support off a 23.6% Fib. Retracement. On Thur. it printed a Bullish Engulfing signal of a Doji. I’ll look for follow-through above the pre-pullback high closes. My Stop will be just above the recent Support and my 1st Target will be the alignment of Weekly S/R and a 38.2% Fib. Extension.

Trader Vision tells us that earnings are out of the way for over 2 months. It also shows us that we have 5 Bullish Conditions versus 1 Bearish Condition (short-term pullback or consolidation) in favor of the setup. In addition, it tells us we have plenty of liquidity on this ticker.

TV20/20 also shows us that this trade plan can achieve our Trade Goal even prior to reaching Target #1. However, if we did reach the 1st Target, we could sell the whole position for $450 profit, achieving a 3.31:1 Reward/Risk. If were able to sell only half there and hold the rest until the 2nd Target, we’d get 4.28:1, booking $582 in profit and netting a 13.9% overall trade.

Having this knowledge before a trade is even entered makes it much easier to control emotions and maintain discipline.

Below is my markup of the chart and the trade plan as laid out by Trader Vision 20/20.  As a bonus, if you click the green button below, you’ll be able to watch a video of the chart markup and trade planning process.

The HZNP Trade Setup – As of 8-30-18

HZNP Chart Setup as of  8-30-18

The Trade Plan

HZNP Trade Plan for 8-31-18

Note how Trader Vision 20/20 does so much of the work for you.  Knowing the ratio of Bullish Conditions to Bearish ones as well as the overall risk of the position size, risk to Stop out and the Reward possible at each Target price can help a great deal with controlling our emotions.  Knowing the dollar impact of every scenario ahead of time, allows us to make calm decisions during the trade.  It really takes the pressure off.  No guesswork.  No surprises.  No emotional roller coaster.

To see a short video of this trade’s chart markup and trade planning, click the button below.


[button_2 color=”light-green” align=”center” href=”https://youtu.be/eNUftboPqyc” new_window=”Y”]Trade Plan Video[/button_2]

Put the power to Trader Vision 20/20 to work for you…

[button_2 color=”orange” align=”center” href=”https://hitandruncandlesticks.com/product/trader-vision-20-20-monthly-subscription2/” new_window=”Y”]TV20/20 Software[/button_2]


Testimonial

Trader Vision immediately simplified the process…immediately it provided that information and guidance to me. I knew what I would risk for how much reward, I began taking trades off at the 1st target, 2nd target, I was no longer holding all my trades for the homerun. I also began implementing the stop losses if and when they were reached, not just hoping the stock would recover.  It then became easier to see what patterns were working for me and which were not.  It provided a much more relaxed and stress-free environment. –Joan G


***************************************************************************************************

Investing and Trading involve significant financial risk and are not suitable for everyone. Ed Carter is not a licensed financial adviser nor does he offer trade recommendations or investment advice to anyone. No communication from Hit and Run Candlesticks Inc. is to be considered financial or trading advice. All information is intended for Educational Purposes Only. Terms of Service.

***************************************************************************************************

Traders Lifestyle

Traders Lifestyle

Traders LifestyleThere are good days trade, and there are days when it’s better take the day off and enjoy the privileges of a Traders Lifestyle.  Facing a 3-day weekend with the possibility of 200 billion of new tariffs levied against China new week hanging over the markets head, today might be just such a day!

I have personally taken profits and trimmed my holdings all week to reduce risk heading into the long weekend.  I hope many of you have done the same, and honestly, I hope many of you are not even around to read this morning note because you have already taken off for the weekend.  If you are still here, keep in mind volumes could become very light and choppy after the morning rush.  If a trade deal with Canada come to fruition, we will likely see a flurry of activity but keep in mind profit-taking, and risk reduction will be on the mind of a good many traders today.   Plan your risk carefully and enjoy the last official days of summer this Labor day weekend!

On the Calendar

The last day of August Economic Calendar gets going with Chicago PMI at 9:45 AM Eastern.  Forecasters suggest a slight pullback from a very high level to 63.8 vs. the 65.5 reading in July on PMI.  Then at 10:00 AM Consumer Sentiment according to consensus will slightly increase to 95.5 in August.  There are 6-bond settlements today and the Baker-Hughes Rig Count @ 1:00 PM to close out the August calendar.

Today the Earnings Calendar is very light showing only five companies reporting results.  They are BFRA, CANF, RENN, RUBY & BIG to finish up the August earnings.

Action Plan

Asian and European markets seemed to follow the US turn lower yesterday with across the board losses in their major indexes.  Surprisingly US Futures are not suggesting a substantial gap down but instead indicate just modest decline at the open.  The Bulls have certainly been tenacious this week, and perhaps they have still have the energy to close this last trading day in August on a high note.  Or maybe they are holding out and hoping the trade agreement with Canada will get announced sometime before it Friday deadline expires.

Unfortunately, as we slide into a 3-day weekend and a 200 billion tariff threat against China next week could also have the bears on a prowl.  Remember this is the get-a-way day, and a lot of traders will abandon their computers in favor of celebrating Labor Day and the lasts official days of summer.  Volume could be light and very choppy after the morning rush.  Plan your risk carefully as anything is possible over the long weekend.  Have a wonderful weekend everyone!

Trade Wisely,

Doug

[button_2 color=”green” align=”center” href=”https://youtu.be/23_QbPAUA_o”]Morning Market Prep Video[/button_2]

Slow Nervous Bullish Trend Trading Hobby or Business

Slow Nervous Bullish Trend

The SPY and markets are Slow Nervous but still a Bullish Trend, for now at least With the 3-day weekend and the political rhetoric, the market is feeling a little nervous. I find at times like this it’s best to close a few positions and cut positions in half. To keep a good perspective on the market, I look at what I call my Red, White and Blue chart, no candlesticks on the chart, (3-EMA / 8-EMA / 34-EMA) to see what the basic trend is doing; it really does help with all the noise. Create a chart like this for yourself, it’s easy, and it works.

Trading Hobby or Business?

How is your trading going? Has it been just a hobby? Are you seeing growth in your account, 5% – 10% -15% per month?

Hello, Rick Saddler founder and president of Hit and Run Candlesticks, below are five little tips that might help. With 30 years of trading under my belt and an account that’s up 250% in 8 months, I might have something to say.

  1. Base hits.
  2. Profit into strength.
  3. Price action. Allow the candle and pattern to complete?
  4. Turn off the news and do your on charting?
  5. Look for the resting and testing of a trend.

Look your not going to learn to trade, or what it takes to trade in just a few days it takes time, and the true desire to want the lifestyle. And it is a great lifestyle. Click on the Road To Wealth link below if you want to see my trading account statement. That’s right I practice what I preach, and I don’t mind sharing good or bad months. Yes, we all have bad days weeks or months too.

Trading Results

Our “Road to Wealth” Account Statement is posted on the website for you to see and follow. 2018 YTD (Through) July) +246% See for yourself. Want to learn more about how Rick Saddler does it?

HRC Trading Tools I Use

Smart Phone APP

Go to your APP store and download “HRC Trading.”

Every Day ChartingTC2000

Trade PlanningTrader Vision 2020

Trading platform and Brokerage

Trading Platform – TradeHawk

Brokerage – Tradier

Stock Only Trades – Flat $16.00 per month

Stock and Option Trades – Flat $159.00 per month

Contact Us if you have questions

Membership ServicesPrivate 2-Hour Coaching

Past Performance Is No Guarantee of Future Results

Investing and Trading involve significant financial risk and is not suitable for everyone. No communication from Hit and Run Candlesticks Inc, Right Way Option, Trader Vision 2020 or Rick Saddler, Doug Campbell, Ed Carter, Steve Risner is to be considered financial or trading advice. All information is intended for Educational Purposes Only. Terms of Service.

Rick Saddler, Doug Campbell, Ed Carter, Steve Risner is not a licensed financial adviser nor does he offer trade recommendations or advice to anyone.


You Gota Love Trend Lines TRUE bullish above $12.70 • Protective stop $12.30

You Gota Love Trend Lines

7-touches on a trend line screams “You Gota Love Trend Lines.” TRUE has used the same trend line for the past three months. Yesterday after a couple of weeks of consolidation TRUE ran the stops all the way to the trend line where the buyers couldn’t get in fast enough. The weekly chart is bouncing off the T-Line like a well-oiled machine. Holding over the $12.40 area is bullish for TRUE and over $12.70 we are thinking a bullish buy with a $12.30 protective stop. Check out the TraderVision blog for target zones.

Past performance is not indicative of future returns

Good Trading, Rick, and Trading Team

This link takes you to a project account that Rick started so members and students could see how it works Monthly Trading Results updated the first week of each month.

What’s on Rick’s watchlist today? A 246% plus increase in 7 months can’t be all wrong.

[button_2 color=”red” align=”center” href=”https://hitandruncandlesticks.com/become-a-member/” new_window=”Y”]If You Love What You Do, You Will Never Work A Day In Your Life[/button_2]

____________________________________________________________

SPY • Rest and Test Soon?

WOW! What a great day in the market yesterday, the buyers pulled further away from the T-Line making yesterday the tenth day in a bullish T-Line Run. Reminder!!!! Monday is a holiday, and the market will be closed. Friday everyone will be thinking about getting out of town. Market volume will likely be low and slow so I for one will be thinking about profits today.

We have yet to test the recent breakout ($286.63) I would suspect we will soon see rest and test, just something to think about.

T-Line • Traders Best Friend

Ten days in a T-Line Run or Ten days of sweet money-making a trend! Price action might be getting a little far from the T-Line, we might need to see price action slow up a little to allow the T-Line to catch up.

****VXX – Has been trying shape a bottom for the past 8-days, over the T-Line could lite a little fire.

Focus Trading Education

Candlesticks • Price Action • T-Line • T-Line Bands • Support • Resistance • Trend • Trendlines • Chart Patterns • Buy Box • Volatility Stops • Profit Zones • Entry Zones • Protective Stops • RBB Rounded Bottom Breakout Strategy • Pop Out of The Box Strategy • Pinball Strategy • Trade Planning, Fibonacci, Stoch/RSI

Subscription PlansPrivate 2-Hour Coaching

Testimonial

This is not your usual service that sends out a ton of stock recommendations, and then cherry picks the winners to show you how great they are. Hit and Run Candlesticks and Right Way Options are truly educational services. They taught me how to trade not what to trade. The entire team: Rick, Doug, Steve, and Ed are there to help and answer your questions. They are awesome. They cut years off my learning curve. And it’s a team effort. Everyone in the room (all the members) are there to help with invaluable insights and advice. The only service you will ever need. Thanks to all the team for how you have helped me and for all you do. –Jonathan Bolnick

Rare to have a service teach you how they find their choices but, HRC/RWO teach you how to fish instead of fishing for you. And, your ideas are not panned but shared, implemented, or improved. Sharing is caring. –Thomas Bradly


Past performance is not indicative of future returns

Investing and Trading involve significant financial risk and is not suitable for everyone. No communication from Hit and Run Candlesticks Inc, Right Way Option, Trader Vision 2020, Top Gun Futures or Rick Saddler, Doug Campbell, Ed Carter, Steve Risner is to be considered financial or trading advice. All information is intended for Educational Purposes Only. Terms of Service.

Rick Saddler, Doug Campbell, Ed Carter, Steve Risner is not a licensed financial adviser nor do they offer trade recommendations or advice to anyone.


TRUE Setup and Trade Plan

Today’s Featured Trade Idea is TRUE.

Members can join us in Trading Room #1 as Rick reviews the TRUE setup and all our member Trade-Ideas at 9:10am Eastern.  For now, here are my own analysis and a potential trade plan made using our Trader Vision 20/20 software.

TRUE broke it’s downtrend in June and has been trending Bullish all summer. after it’s last big leg higher (on earnings) it took profit and consolidated for a couple weeks. Then Wed. bears tried to drive it down. However, at the trend line the Bulls stepped in and drove it back up, resulting in a large Bullish Engulfing signal.

I will look for a slight inside day Entry using the high of the big Earnings candle as the 1st Target and the alignment of Weekly support/resistance level and the 23.6% Fib Extension as the 2nd Target. The Stop will be below Wed. Candle body and the Support level from the last couple weeks.

Trader Vision shows us that earnings are out of the way and we have 2.5mo until they come around again. It also tells us that we have 6 Bullish Conditions versus 1 Bearish
Condition (the short-term consolidation trend prior to Wed. b/o candle).

TV20/20 also allowed us to make and then easily tune a plan that meets our Trade Goal. It shows us the current plan delivers 2.25:1 Reward/Risk at the 1st Target and 3.12:1 overall at the 2nd Target ($375/$120). In addition, it tells us that the trade only needs to reach $13.87 in order to sell the entire position and make our Trade Goal.

Having this knowledge before a trade is even entered makes it much easier to control emotions and maintain discipline.

Below is my markup of the chart and the trade plan as laid out by Trader Vision 20/20.  As a bonus, if you click the green button below, you’ll be able to watch a video of the chart markup and trade planning process.

The TRUE Trade Setup – As of 8-29-18

TRUE Chart Setup as of 8-29-18

The Trade Plan

TRUE Trade Plan for 8-30-18

Note how Trader Vision 20/20 does so much of the work for you.  Knowing the ratio of Bullish Conditions to Bearish ones as well as the overall risk of the position size, risk to Stop out and the Reward possible at each Target price can help a great deal with controlling our emotions.  Knowing the dollar impact of every scenario ahead of time, allows us to make calm decisions during the trade.  It really takes the pressure off.  No guesswork.  No surprises.  No emotional roller coaster.

To see a short video of this trade’s chart markup and trade planning, click the button below.


[button_2 color=”light-green” align=”center” href=”https://youtu.be/prRAFj2tXWA” new_window=”Y”]Trade Plan Video[/button_2]

Put the power to Trader Vision 20/20 to work for you…

[button_2 color=”orange” align=”center” href=”https://hitandruncandlesticks.com/product/trader-vision-20-20-monthly-subscription2/” new_window=”Y”]TV20/20 Software[/button_2]


Testimonial

Trader Vision immediately simplified the process…immediately it provided that information and guidance to me. I knew what I would risk for how much reward, I began taking trades off at the 1st target, 2nd target, I was no longer holding all my trades for the homerun. I also began implementing the stop losses if and when they were reached, not just hoping the stock would recover.  It then became easier to see what patterns were working for me and which were not.  It provided a much more relaxed and stress-free environment. –Joan G


***************************************************************************************************

Investing and Trading involve significant financial risk and are not suitable for everyone. Ed Carter is not a licensed financial adviser nor does he offer trade recommendations or investment advice to anyone. No communication from Hit and Run Candlesticks Inc. is to be considered financial or trading advice. All information is intended for Educational Purposes Only. Terms of Service.

***************************************************************************************************