WRD Setup and Trade Plan

Today’s Featured Trade Idea is WRD.

Members can join us in Trading Room #1 as Rick reviews this setup and other Trade-Ideas at 9:10am Eastern.  For now, here are my own analysis and a potential trade plan made using our Trader Vision 20/20 software.

Note: Beware the overall market indecision. Indecisive candles with a short-term bear trend, long-term bull trend and support close below and resistance close above.

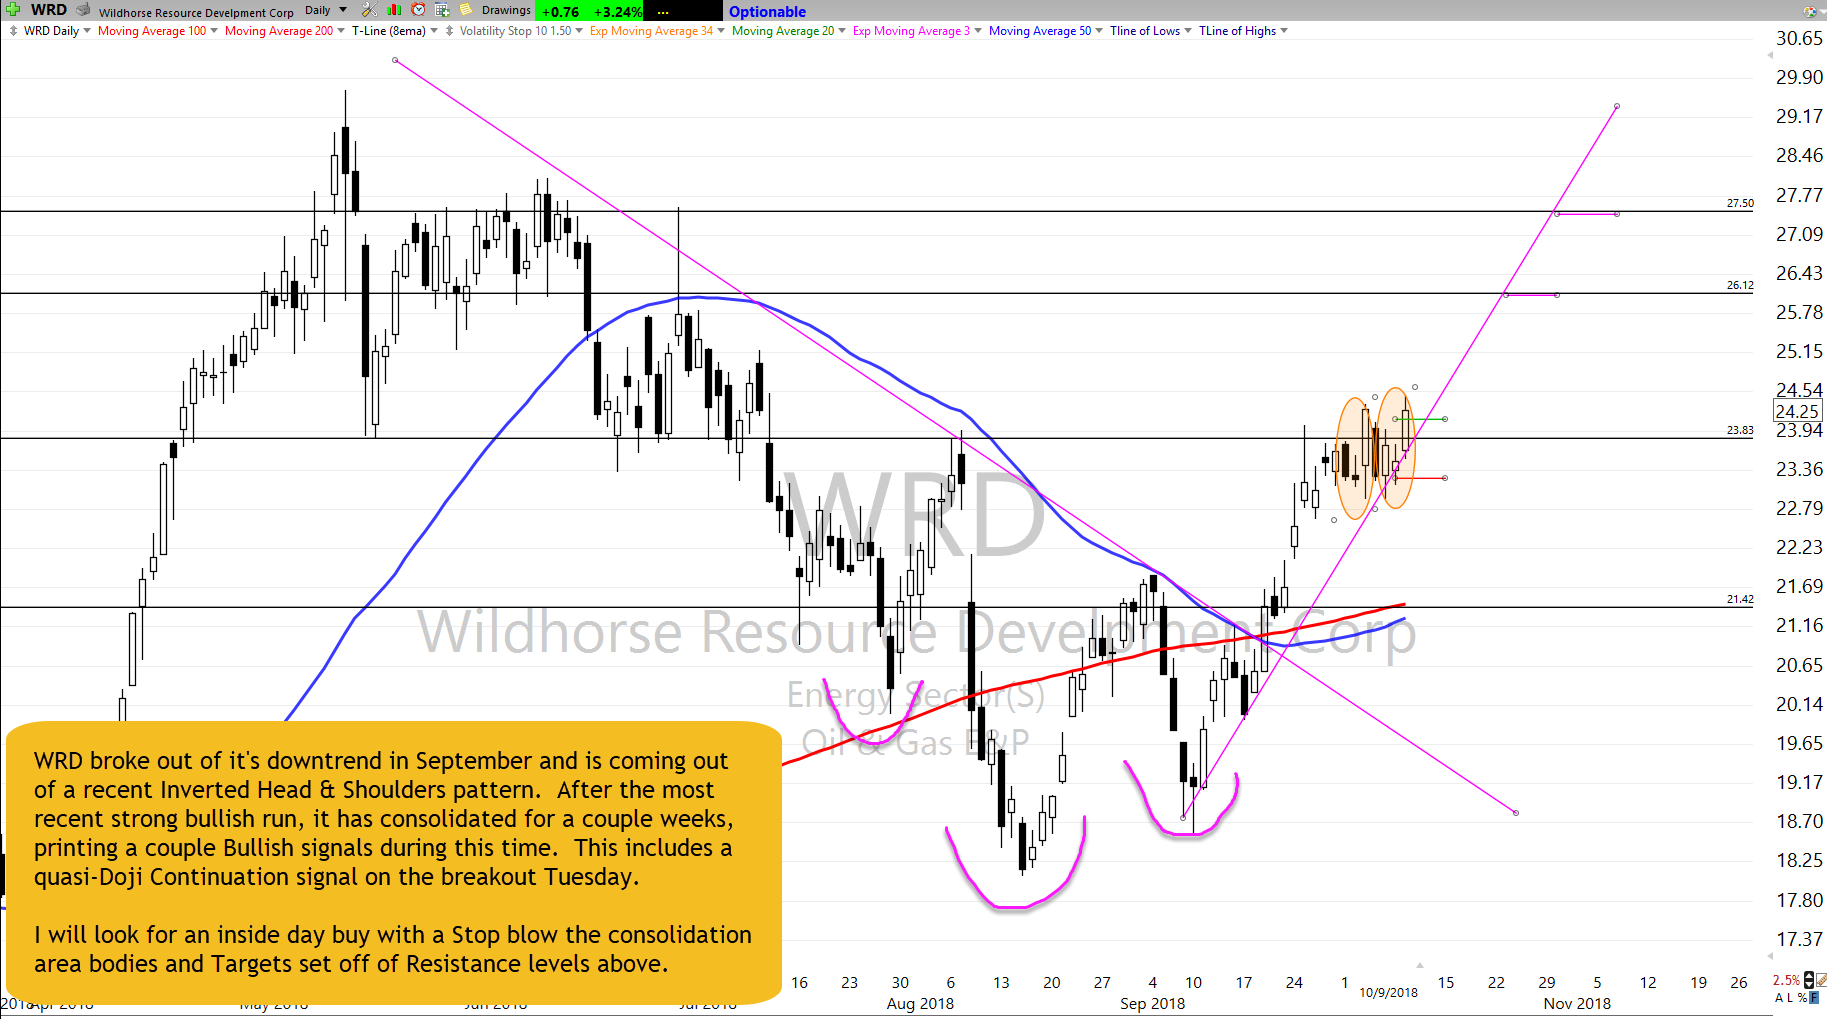
WRD broke out of its downtrend in September and is coming out of a recent Inverted Head & Shoulders pattern. After the most recent strong bullish run, it has consolidated for a couple weeks, printing a couple Bullish signals during this time. This includes a quasi-Doji Continuation signal on the breakout Tuesday.

I will look for an inside day buy with a Stop blow the consolidation area bodies and Targets set off of Resistance levels above.

Trader Vision tells us that we should have about a month until WRD reports again. It also shows us that we have 4 Bullish conditions and 2 Bearish conditions in the chart setup. Both the bearish long-term symbol bias and the short-term market bias are expected with this chart and market. Also, the last 3 candles are not technically a Doji Continuation pattern but do convey the same sentiment.

TV20/20 tells us this plan offers a 2.22:1 Reward/Risk to the 1st Target, with a risk to Stop-out of $135. It also tells us the ticker must reach $26.43 in order to achieve our Trade Goal. Still, if we can sell half there and the rest at Target #2, we can achieve almost 3:1 Reward/Risk and book a $400 profit.

Having this knowledge before a trade is even entered makes it much easier to control emotions and maintain discipline.

Below is my markup of the chart and the trade plan as laid out by Trader Vision 20/20.  As a bonus, if you click the green button below, you’ll be able to watch a video of the chart markup and trade planning process.

The WRD Trade Setup – As of 10-9-18

WRD Chart Setup as of 10-9-18

The Trade Plan

WRD Trade Plan for 10-10-18

Note how Trader Vision 20/20 does so much of the work for you.  Knowing the ratio of Bullish Conditions to Bearish ones as well as the overall risk of the position size, the risk to Stop out and the Reward possible at each Target price can help a great deal with controlling our emotions.  Knowing the dollar impact of every scenario ahead of time, allows us to make calm decisions during the trade.  It really takes the pressure off.  No guesswork.  No surprises.  No emotional roller coaster.

To see a short video of this trade’s chart markup and trade planning, click the button below.


[button_2 color=”light-green” align=”center” href=”https://youtu.be/QkBmTjRa2UM” new_window=”Y”]Trade Plan Video[/button_2]

Put the power to Trader Vision 20/20 to work for you…

[button_2 color=”orange” align=”center” href=”https://hitandruncandlesticks.com/product/trader-vision-20-20-monthly-subscription2/” new_window=”Y”]TV20/20 Software[/button_2]


Testimonial

Trader Vision immediately simplified the process…immediately it provided that information and guidance to me. I knew what I would risk for how much reward, I began taking trades off at the 1st target, 2nd target, I was no longer holding all my trades for the homerun. I also began implementing the stop losses if and when they were reached, not just hoping the stock would recover.  It then became easier to see what patterns were working for me and which were not.  It provided a much more relaxed and stress-free environment. –Joan G


***************************************************************************************************

Investing and Trading involve significant financial risk and are not suitable for everyone. Ed Carter is not a licensed financial adviser nor does he offer trade recommendations or investment advice to anyone. No communication from Hit and Run Candlesticks Inc. is to be considered financial or trading advice. All information is intended for Educational Purposes Only. Terms of Service.

***************************************************************************************************

Tempory Stalemate?

Temporary Stalemate?

StalemateAsia modestly higher overnight and European markets modestly lower the US Futures seem to have reached a temporary stalemate suggesting a flat open.  I’m expecting an oddly slow and choppy morning with both the bulls and bears struggling to find inspiration.  With the 4th quarter earnings season perhaps they are simply content to wait with the potential interest rate increase impacts starting to weigh heavily on the mind of the market.

Certainly, a rally to test resistance is possible, but there seems to be an equal chance that a retest of recent lows.  Stay very focused on price action as a stalemate like this can suddenly spring to life and is very susceptible to head fakes and whipsaws.  With earnings season just around the corner, we should expect higher volatility to stick around for several weeks.  Plan your risk carefully.

On the Calendar

Hump-day on Economic Calendar begins with the Mortgage Applications at 7:00 AM Eastern.  At 8:30 PM the PPI at 10:00 AM expects a rise of only 0.2 percent for the September headline number.  We have the Atlanta Fed Business Inflation Expectations as well at Wholesale Trade number at 10:00 AM.  A 3-yr Note Auction @ 11:30, Fed Speaker a@ 12:15 PM, 10-yr Note Auction @ 1:00 PM, and another Fed Speaker at 6:00 PM to close the calendar day.

On the Earnings Calendar, we have eight companies reporting the most notable, FAST, stepping up before the bell today.

Action Plan

A very choppy day yesterday as the market seemed content to consolidate near recent lows as the market becomes increasingly concerned about the effects of the FOMC rate hikes.  I think the bigger concern is that Earnings Season begins next week and companies have a lot of live up to at current valuations.  As a result, increased volatility is likely over the next few weeks with big morning gaps and challenging price action.

With Asian markets having closed modestly higher across the board overnight and European markets currently down across the board, US Futures seem a bit confused as to what to do this morning.  As I write this, the Dow Futures are currently dead flat.  Perhaps the PPI number at 8:30 AM Eastern will give the market some inspiration, but as of now, I’m planning for a very slow and choppy morning.  After that its anyone’s guess.

Trade Wisely,

Doug

[button_2 color=”green” align=”center” href=”https://youtu.be/eEEpZhtnFNM”]Morning Market Prep Video[/button_2]

WRD Setup To Challenge June Highs Bullish above $24.10

WRD Setup To Challenge June Highs

WRD  (Wildhorse Resource Development Corp) looks to be set up to challenge the June highs or near $28.00. After trending down for four months, WRD has moved up through the downtrend line. In the past 25 days or so the price action has shown good bullishness, and the past week WRD has rested. Yesterday price broke out of a little flag with V-Stop support.

Hit and Run Candlesticks Monthly Membership Join In

Rounded Bottom Breakout Workshop Register

Know what I am buying or selling for 30-Days Bonus


Past performance is not indicative of future returns

Good Trading, Rick, and Trading Team

____________________________________________________________

SPY • SP-500

Price closed below the T-Line and the T-Line Regression lines. The V-Stop is red and above price action. The T-Line has crossed down below the 20-SMA and testing the 34-EMA with yesterdays price closing below the 50-SMA. The weekly charts candle is currently a Doji below the T-Line with a Bearish Doji Continuation Pattern holding support (for now).

****VXX – Watch for bullish buy patterns

Focus Trading Education

Candlesticks • Price Action • T-Line • T-Line Bands • Support • Resistance • Trend • Trendlines • Chart Patterns • Buy Box • Volatility Stops • Profit Zones • Entry Zones • Protective Stops • RBB Rounded Bottom Breakout Strategy • Pop Out of The Box Strategy • Pinball Strategy • Trade Planning, Fibonacci, Stoch/RSI

Subscription PlansPrivate 2-Hour Coaching

Testimonial

This is not your usual service that sends out a ton of stock recommendations, and then cherry picks the winners to show you how great they are. Hit and Run Candlesticks and Right Way Options are truly educational services. They taught me how to trade not what to trade. The entire team: Rick, Doug, Steve, and Ed are there to help and answer your questions. They are awesome. They cut years off my learning curve. And it’s a team effort. Everyone in the room (all the members) are there to help with invaluable insights and advice. The only service you will ever need. Thanks to all the team for how you have helped me and for all you do. –Jonathan Bolnick

Rare to have a service teach you how they find their choices but, HRC/RWO teach you how to fish instead of fishing for you. And, your ideas are not panned but shared, implemented, or improved. Sharing is caring. –Thomas Bradly


Past performance is not indicative of future returns

Investing and Trading involve significant financial risk and is not suitable for everyone. No communication from Hit and Run Candlesticks Inc, Right Way Option, Trader Vision 2020, Top Gun Futures or Rick Saddler, Doug Campbell, Ed Carter, Steve Risner is to be considered financial or trading advice. All information is intended for Educational Purposes Only. Terms of Service.

Rick Saddler, Doug Campbell, Ed Carter, Steve Risner is not a licensed financial adviser nor do they offer trade recommendations or advice to anyone.


AXGN Setup and Trade Plan

Today’s Featured Trade Idea is AXGN (Short).

Members can join us in Trading Room #1 as Rick reviews this setup and other Trade-Ideas at 9:10am Eastern.  For now, here are my own analysis and a potential trade plan made using our Trader Vision 20/20 software.

AXGN broke its long-term uptrend by falling off a cliff in mid-summer. It has failed multiple attempts to break the downtrend (most recently the end of last week). It is currently in a “Dreaded h” pattern, shows a Death Cross signal as of Monday and also a quasi-Doji Continuation signal.

I will be looking to Enter Short on a breakout of the “h” (below Monday’s low) with a Stop set above a couple potential resistance levels (still tight) and Targets defined off Daily and Weekly chart S/R levels.

The 1st thing to note that this is a large position. Trader Vision tells us it represents almost 8% of the account. This is more acceptable on a Short, because the company going out of business would be in our favor as a short. In addition, while it theoretically can go to infinity in price, the practical limit makes this risk more palatable.

Trader Vision tells us we should have 3-4 weeks until the next earnings report. It also shows us that this chart setup has 5 Bearish and only 1 Bullish condition.

TV20/20 tells us this trade plan offers very low risk to stop ($64) with very high potential reward ($986). At the 1st target, the Reward/Risk is 5.83:1 ($373/$64). So we can make our trade goal by covering the short at Target #1. However, if we can cover only half there and hold the rest until target #2, we can achieve a huge 15.41:1 Reward/Risk.

Having this knowledge before a trade is even entered makes it much easier to control emotions and maintain discipline.

Below is my markup of the chart and the trade plan as laid out by Trader Vision 20/20.  As a bonus, if you click the green button below, you’ll be able to watch a video of the chart markup and trade planning process.

The AXGN Trade Setup – As of 10-8-18

AXGN Chart Setup as of 10-8-18

The Trade Plan

AXGN Trade Plan for 10-9-18

Note how Trader Vision 20/20 does so much of the work for you.  Knowing the ratio of Bullish Conditions to Bearish ones as well as the overall risk of the position size, the risk to Stop out and the Reward possible at each Target price can help a great deal with controlling our emotions.  Knowing the dollar impact of every scenario ahead of time, allows us to make calm decisions during the trade.  It really takes the pressure off.  No guesswork.  No surprises.  No emotional roller coaster.

To see a short video of this trade’s chart markup and trade planning, click the button below.


[button_2 color=”light-green” align=”center” href=”https://youtu.be/yPZflRVp6oY” new_window=”Y”]Trade Plan Video[/button_2]

Put the power to Trader Vision 20/20 to work for you…

[button_2 color=”orange” align=”center” href=”https://hitandruncandlesticks.com/product/trader-vision-20-20-monthly-subscription2/” new_window=”Y”]TV20/20 Software[/button_2]


Testimonial

Trader Vision immediately simplified the process…immediately it provided that information and guidance to me. I knew what I would risk for how much reward, I began taking trades off at the 1st target, 2nd target, I was no longer holding all my trades for the homerun. I also began implementing the stop losses if and when they were reached, not just hoping the stock would recover.  It then became easier to see what patterns were working for me and which were not.  It provided a much more relaxed and stress-free environment. –Joan G


***************************************************************************************************

Investing and Trading involve significant financial risk and are not suitable for everyone. Ed Carter is not a licensed financial adviser nor does he offer trade recommendations or investment advice to anyone. No communication from Hit and Run Candlesticks Inc. is to be considered financial or trading advice. All information is intended for Educational Purposes Only. Terms of Service.

***************************************************************************************************

50-SMA • 200-SMA Death Cross Past performance is not indicative of future returns

50-SMA • 200-SMA Death Cross

The 50-SMA crossing below the 200-SMA traders term as a death cross. Looking at the AXGN daily 3chart, you can see price action has brought the 50-SMA down to and now crossing below the 200-SMA. On the weekly chart, AXGN is looking at a Blue Ice Failure, a couple of failed highs and a bearish T-Line Run. The candle pattern (price action) on the weekly chart is also set up for a Bearish Pop Out of The Box.

Past performance is not indicative of future returns

Good Trading, Rick, and Trading Team

[button_1 text=”Super%20%2030-Day%20Live%20Alert%20BONUS” text_size=”32″ text_color=”#000000″ text_font=”Montserrat;google” text_bold=”Y” text_letter_spacing=”0″ subtext_panel=”Y” subtext=”Click%20Here%20Learn%20More%2C%20Only%2030%20offered” subtext_size=”14″ subtext_color=”#ffffff” subtext_bold=”Y” subtext_underline=”Y” subtext_letter_spacing=”0″ text_shadow_panel=”N” styling_width=”40″ styling_height=”30″ styling_border_color=”#000000″ styling_border_size=”1″ styling_border_radius=”6″ styling_border_opacity=”100″ styling_gradient_start_color=”#2780f6″ styling_gradient_end_color=”#2780f6″ drop_shadow_panel=”N” inset_shadow_panel=”N” align=”center” href=”https://ob124-cb6085.pages.infusionsoft.net/” new_window=”Y”/]


____________________________________________________________

SPY • SP-500

Yesterday the SPY closed below our Red T-Line Reg Channel Line for the third day in a row. The candle (price action) closed under the close of the previous candle but with a wick that suggests intraday buyers are tiptoeing around (Hammer). Yesterday was the third lower low, and lower high and price action is flirting with the 50-SMA. The longer bigger picture is that the trend is still up, but the trading trend is moving down. There is going to be big rocks and sharks in the water so navigate carefully, take it slow. Simply, ask yourself what the chart is doing that corresponds to your trading timeline. Another way to look at the trading trend is to look at the price and the T-Line, who’s leading who?

****VXX – The VXX gave back all it was gains yesterday but still in a bullish T-Line Run.

Focus Trading Education

Candlesticks • Price Action • T-Line • T-Line Bands • Support • Resistance • Trend • Trendlines • Chart Patterns • Buy Box • Volatility Stops • Profit Zones • Entry Zones • Protective Stops • RBB Rounded Bottom Breakout Strategy • Pop Out of The Box Strategy • Pinball Strategy • Trade Planning, Fibonacci, Stoch/RSI

Subscription PlansPrivate 2-Hour Coaching

Testimonial

This is not your usual service that sends out a ton of stock recommendations, and then cherry picks the winners to show you how great they are. Hit and Run Candlesticks and Right Way Options are truly educational services. They taught me how to trade not what to trade. The entire team: Rick, Doug, Steve, and Ed are there to help and answer your questions. They are awesome. They cut years off my learning curve. And it’s a team effort. Everyone in the room (all the members) are there to help with invaluable insights and advice. The only service you will ever need. Thanks to all the team for how you have helped me and for all you do. –Jonathan Bolnick

Rare to have a service teach you how they find their choices but, HRC/RWO teach you how to fish instead of fishing for you. And, your ideas are not panned but shared, implemented, or improved. Sharing is caring. –Thomas Bradly


Past performance is not indicative of future returns

Investing and Trading involve significant financial risk and is not suitable for everyone. No communication from Hit and Run Candlesticks Inc, Right Way Option, Trader Vision 2020, Top Gun Futures or Rick Saddler, Doug Campbell, Ed Carter, Steve Risner is to be considered financial or trading advice. All information is intended for Educational Purposes Only. Terms of Service.

Rick Saddler, Doug Campbell, Ed Carter, Steve Risner is not a licensed financial adviser nor do they offer trade recommendations or advice to anyone.


A Piling on of bad news.

A Piling on of bad news.

bad newsWhen the market starts to turn lower, it always seems to attract a piling on of bad news.  Yesterday, after the close, the IMF lowered world growth estimates siting trade disruptions.  As a result, Asian and European markets reacted lower, and consequently, the US Futures are suggesting another gap down punishing those that held overnight.  The buy the dip crowd will likely feel some pain this morning.

Don’t rule out the possibility of a test of yesterdays but with any luck, the bulls will find the energy to hold a higher low and establish a safer entry point than just blindly buying the dip.  Expect volatility to remain high with challenging price action that could include substantial whipsaws and head fakes.  Be very careful and remember you don’t have to the trade every day to be a successful trader and remember cash is a position.

On the Calendar

The Tuesday Economic Calendar kicks off early with the NFIB Small Business Optimism Index at 6:00 AM Eastern.  At 8:55 AM we will hear from the Redbook report, we have a Fed speaker at 10:00 AM, four Bill Auctions between 11:30 AM and 1:00 PM.  Late this evening we have Fed speakers at 9:15 PM and 10:35 PM Eastern.

We have only four companies reporting earnings today.  Before the market, we have AZZ & HELE with CNBKA & IDT reporting after the close of trading today.

Action Plan

Yesterday played out about as expected ending the day with hope as the Bulls came in chanting “buy the dip.”  I truly dislike that phrase!  It encourages irresponsibility and gambling as traders jump blindly into trades with no thought to the fact their action could be absolutely wrong!  Those that blindly jumped yesterday before the close will obviously feel the error of their ways with the futures pointing to a gap down of more than 100 points this morning.

After the close yesterday, the IMF lowered world growth estimates siting trade disruptions.  Emerging Markets which have been in a downtrend for most of the year will remain under pressure according to the IMF due to there weakening currency against the US Dollar.  After the morning gap down expect some whippy price action and don’t rule out the possibility of a pullback to test yesterdays low.  If tested, I think there is a high probability it will hold as support at least for the short-term.  The very best scenario is if the Bull step in holding a higher low and a willingness to demonstrate follow-through buying.  A pullback that holds a higher low and provides a lower risk entry?  Where have I heard that before?  Your choice, enter with a plan or blindly buy the dip.

Trade Wisely,

Doug

[button_2 color=”green” align=”center” href=”https://youtu.be/9SLjhHJa5vc”]Morning Market Prep Video[/button_2]

MNK Setup and Trade Plan

Today’s Featured Trade Idea is MNK.

Members can join us in Trading Room #1 as Rick reviews this setup and other Trade-Ideas at 9:10am Eastern.  For now, here are my own analysis and a potential trade plan made using our Trader Vision 20/20 software.

MNK formed a Blue Ice Failure pattern on a huge Bearish Kicker signal on Thursday. On Friday there was indecisive trading (profit taking by bears), forming a Spinning Top / Doji candle that sets up the potential of a Bearish Doji Continuation pattern.

I will be looking for a Short Entry on negative trading with a Stop not far above. I will use 3 Targets for the trade since a Blue Ice Failure pattern tends to fall to the 200sma. Those target levels are defined by Daily and Weekly chart history.

Trade Vision tells us we should have a month until the next earnings report. It also shows us that this chart setup has 4 Bearish conditions and 2 Bullish ones (the long-term stock and overall market biases).

TV20/20 shows us that this trade plan offers a $150 risk to stop-out with more than 2:1 Reward at the 1st Target. If all 3 Targets are reached (making it to the 200sma) the trade can give us a 3.45:1 overall Reward/Risk. It also shows us that we need to get below the 1st Target in order to achieve our Trade Goal for this account.

Having this knowledge before a trade is even entered makes it much easier to control emotions and maintain discipline.

Below is my markup of the chart and the trade plan as laid out by Trader Vision 20/20.  As a bonus, if you click the green button below, you’ll be able to watch a video of the chart markup and trade planning process.

The MNK Trade Setup – As of 10-5-18

MNK Chart Setup as of 10-5-18

The Trade Plan

MNK Trade Plan for 10-8-18

Note how Trader Vision 20/20 does so much of the work for you.  Knowing the ratio of Bullish Conditions to Bearish ones as well as the overall risk of the position size, the risk to Stop out and the Reward possible at each Target price can help a great deal with controlling our emotions.  Knowing the dollar impact of every scenario ahead of time, allows us to make calm decisions during the trade.  It really takes the pressure off.  No guesswork.  No surprises.  No emotional roller coaster.

To see a short video of this trade’s chart markup and trade planning, click the button below.


[button_2 color=”light-green” align=”center” href=”https://youtu.be/qbQOaMkj4uw” new_window=”Y”]Trade Plan Video[/button_2]

Put the power to Trader Vision 20/20 to work for you…

[button_2 color=”orange” align=”center” href=”https://hitandruncandlesticks.com/product/trader-vision-20-20-monthly-subscription2/” new_window=”Y”]TV20/20 Software[/button_2]


Testimonial

Trader Vision immediately simplified the process…immediately it provided that information and guidance to me. I knew what I would risk for how much reward, I began taking trades off at the 1st target, 2nd target, I was no longer holding all my trades for the homerun. I also began implementing the stop losses if and when they were reached, not just hoping the stock would recover.  It then became easier to see what patterns were working for me and which were not.  It provided a much more relaxed and stress-free environment. –Joan G


***************************************************************************************************

Investing and Trading involve significant financial risk and are not suitable for everyone. Ed Carter is not a licensed financial adviser nor does he offer trade recommendations or investment advice to anyone. No communication from Hit and Run Candlesticks Inc. is to be considered financial or trading advice. All information is intended for Educational Purposes Only. Terms of Service.

***************************************************************************************************