Rick’s Featured Trade Ideas
Today’s featured trade idea and my personal trade plan
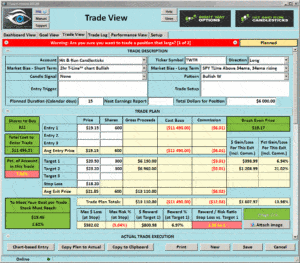
TWTR Long 5-Day Morning Star
Double click the trade plan to enlarge.
This not a recommendation to buy. I am simply sharing a trade I am considering.
 Good Morning, Profit Traders,
We have closed a couple double-digit gains and holding FRIGI +16.5% – Expecting double-digit gains from PARR, WETF, ESND, CEMP, UAN, EDIT, ITCI, NDLS
From a bull’s eye: Is this the perfect bullish storm for the market? Transports are moving higher, the major indices are moving higher even the Q’s are seeing a ray of sun.
The SPY broke out yesterday with a solid close above $221.82 which now becomes the support area. With normal profit taking along the way $228.00 area is the next up point we are watching.
Members Daily Trade Ideas. Be aware of sudden market changes!
This list is reserved for subscribed members
Continue Reading
Rick’s Featured Trade Ideas
Today’s featured trade idea and my personal trade plan
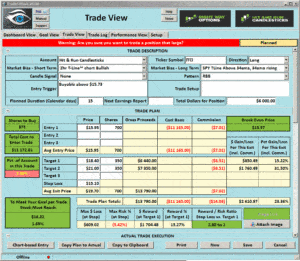
ITCI Long Inverted Head & Shoulder | Doji Continuation pattern |
Double click the trade plan to enlarge.
This not a recommendation to buy. I am simply sharing a trade I am considering.
 Good Morning, Profit Traders,
**We have added a few new longs, we have set up the trade plan for Double-Digit gains
From a bull’s eye: The SPY has found support a1 $219.15 reversed and is now positioned to form a J-Hook continuation pattern (a breakout and follow-though is still needed). $222.20 followed by $224.00 would be good directional targets for the swing trader. $220.40 is now the new minor support line while $219.15is the major support line.
Members Daily Trade Ideas. Be aware of sudden market changes!
This list is reserved for subscribed members
Continue Reading
Rick’s Featured Trade Ideas
Today’s featured trade idea and my personal trade plan
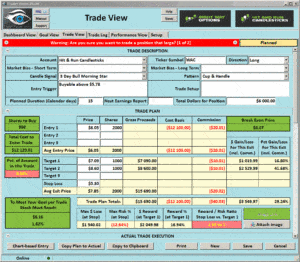
WAC Long Cup & Handle | Belt-hold | 3-Day Morning Star |
Double click the trade plan to enlarge.
This not a recommendation to buy. I am simply sharing a trade I am considering.
 Good Morning, Profit Traders,
From a bull’s eye: Italy voters say NO and the morning futures are higher, but will the bulls win by the end of the week or will the bears?
Follow the chart. (SPY short term) A close above $220.90 would put the bulls in a good position to test last week’s high while weakness below $219.15 would suggest the sellers have the upper hand.
The SPY and IWM charts still suggest the bull is in control with minor profit taking.
Members Daily Trade Ideas. Be aware of sudden market changes!
This list is reserved for subscribed members
Continue Reading
We had an informal session on Saturday that was a lot of fun due to the great questions that everyone brought to the table. I have to admit I truly enjoy the interaction of these informal sessions. Thank you, RWO members!
Click Here to Watch the E-Learning Video
Rick’s Featured Trade Ideas
No trade Ideas today –
Please join us in the trading room today password 1222
Good Morning, Profit Traders,
From a bear’s eye: The Market overall is seeing a profit taking pullback, very clear bearish candles have been drawn this week in the SPY, IWM and the QQQ’s. All three are now trading below the T-Line™. We will be watching if support will hold or give way at important levels.
Not a Bad Week for Hit and Run Candlesticks:
12/1/16 Closed 1/2 SGY +44%
Earlier in the week we closed:
OCN +24.5%
CGNY 10.36%
RT 5.57%
Members Daily Trade Ideas. Be aware of sudden market changes!
This list is reserved for subscribed members
Continue Reading
Rick’s Featured Trade Ideas
Today’s featured trade idea and my personal trade plan
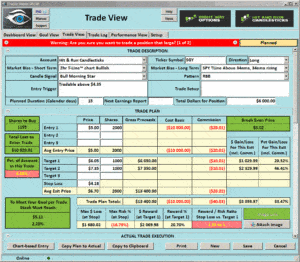
SGY Long | RBB | Double Bottom | Morning Star | Bullish Engulf 3-day chart
Double click the trade plan to enlarge.
This not a recommendation to buy. I am simply sharing a trade I am considering.
 Good Morning, Profit Traders,
From a bear’s eye: Yesterday the IWM chart confirmed a bearish Doji Continuation pattern, price closed below the upper T-Line band and the T-Line, this action suggest the short term sellers are taking control. If the Lower T-Line band is cracked the possibility will increase to a $130.30 test.
The SPY’s Bearish Engulf has closed below the upper T-Line band putting the $219.75 line and the lower T-Line band in jeopardy.
Members Daily Trade Ideas. Be aware of sudden market changes!
This list is reserved for subscribed members
Continue Reading
Rick’s Featured Trade Ideas
Today’s featured trade idea and my personal trade plan
HSC Long | Bullish “W” Pattern | Bull Mat Hold | Continuation pattern
Double click the trade plan to enlarge.
This not a recommendation to buy. I am simply sharing a trade I am considering.
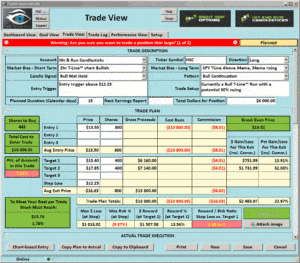 Good Morning, Profit Traders,
From a bull’s eye: Yesterday the SPY printed a Doji supported by our $220.50 line, keeping the T-Line™ Run intact.
IWM not as productive as the SPY was. IWM printed a weak Doji with sellers pushing the buyers to the bottom of the candle, T-Line™ Run still working. 60-min IWM chart closed below the T-Line™ lower band suggesting short-term weakness.
Members Daily Trade Ideas. Be aware of sudden market changes!
This list is reserved for subscribed members
Continue Reading
Rick’s Featured Trade Ideas
Today’s featured trade idea and my personal trade plan
ESND Long | Inverted Head & Shoulder | RBB | Continuation pattern
Double click the trade plan to enlarge.
This not a recommendation to buy. I am simply sharing a trade I am considering.
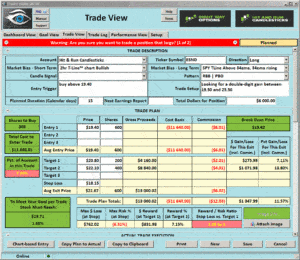 Good Morning, Profit Traders,
From a bull’s eye: Is the market tired and in need of a rest? IWM ended the day with an Evening Star Signal which suggests well-deserved profits are being peeled off.
Yesterday early on I mentioned to the trading room I would be keeping my eye on the hourly chart and you can see the channel tightening at the top and the sellers attack the lower support line with success.
The daily Evening Star Signal on the IWM chart suggest a lower low today, in the very near future, we could see a test of $130.90.
Follow Hit and Run Candlesticks for your updates.
Members Daily Trade Ideas. Be aware of sudden market changes!
This list is reserved for subscribed members
Continue Reading
Last Updated: November 28, 2016
You know what a doji looks like, right? And I bet you’re familiar with the Harami, another essential signal, as well. If you know those two basic signals, spotting and understanding a Harami Cross candlestick pattern should be a cinch. This signal resembles the classic Harami, except the very small second candle of the Harami is replaced by a simple doji that resembles a cross sign. Depending on the price movement and the current trend, the Harami Cross can be bullish or bearish. However, no matter what its color and no matter what its trend, do not risk ignoring this pivotal pattern.
Continue Reading