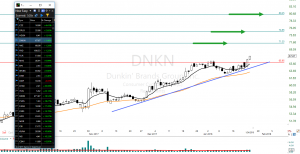
America Runs On DNKN
 America Runs On DNKN, The DNKN brand broke and had created a Bullish J-Hook Continuation pattern that could lead to the $90.00 area with typical bullish price action. The recent Bullish Morning Star was a clue to the recent reversal, and higher lows and bullish price action help create the bullish candle stacking. With support around $65.95, a good entry would be near the support line.
To learn more about my trading tools join me in the trading room or consider Private Coaching. Rick will help coach you to trading success.
Today At 9:10 AM ET. We will demonstrate live how DNKN could be traded using our Simple Proven Swing Trade Tools
► Learn the Power Of Simple Trading Techniques
On October 23, Rick shared GWW as a trade for members to consider and how to use the trading tools listed below. Yesterday the profits would have been about 18.5% or $64160.00 with 100 shares. Using our Simple, Proven Swing Trade Tools and techniques to achieve swing trade profits.
[button_2 color=”blue” align=”center” href=”https://hitandruncandlesticks.com/private-personal-coaching-right-from-the-pros/” new_window=”Y”]Learn The Tools • Learn The Trade • Get Out OF Your Own Way[/button_2]Candlesticks • Price Action T-Line • T-Line Bands • Support • Resistance • Trendlines • Chart Patterns • Buy Box • Volatility Stops • Profit Zones • Entry Zones • Protective Stops • RBB Rounded Bottom Breakout Strategy • Pop Out of The Box Strategy • Pinball Strategy • Continuation Patterns • Trade Planning… Learn More
► Eyes On The Market
Briefly, the SPY felt the breath of the bear yesterday, but by the end of the day, the buyers were able to control the bear’s breath and close the SPY near the middle of its daily candle. IWM ended the day with a Bearish Engulf the bulls will need to pay attention. More sellers could drive IWM below the T-Line…Keep a watchful eye. The QQQ’s also printed a Bearish Engulf with better than average volume, watch price action and the short term trend.
The VXX short-term futures ventured out yesterday and peaked above its recent highs then closed back under cover. Even with a close below the recent highs, the VXX managed to close above the T-Line High; the last seven bars are supported by the T-Line Low Indicator. Price action has printed a Low – High – Higher Low. Just saying.
Rick’s Swing Trade ideas
Member Login – Full Daily List
30-Day Trial • Monthly • Quarterly • Semi-Annual • Annual
Candlesticks • Price Action T-Line • T-Line Bands • Support • Resistance • Trendlines • Chart Patterns • Buy Box • Volatility Stops • Profit Zones • Entry Zones • Protective Stops • RBB Rounded Bottom Breakout Strategy • Pop Out of The Box Strategy • Pinball Strategy • Continuation Patterns
Investing and Trading involve significant financial risk and is not suitable for everyone. No communication from Hit and Run Candlesticks Inc. is financial or trading advice. All information is intended for Educational Purposes Only. Terms of Service.
Rick Saddler is not a licensed financial adviser nor does he offer trade recommendations or advice to anyone except for the trading desk of Hit and Run Candlesticks Inc.
*************************************************************************************


Comments are closed.