Rick’s Featured Trade Ideas
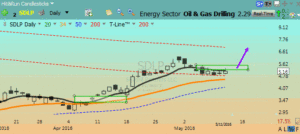
SDLP/Long |20-sma trending | RBB |multi doji bottom |PBO
SDLP| Plan your trade & trade your plan | May 12, 2016
Possible entry plan idea: Buy box $5.21- $5.59
Possible stop plan idea: Protective stop below $5.59
Swing trade playground: $5.21 – $7.90 = 49%
Playground risk reward: 11:1 + depending on | entry | exit | stop
 Yesterday’s featured trade idea was bought.
Still holding SONS and LNKD; doing well for us.
SPY: T-Line ™ chart suggest the buyers are in control.
7:00 am: The SPY showed a little weakness yesterday closing below the T-Line and the $207 area losing .94%. As we have stated many times over the last couple of weeks, the $207 area is very important to both the Bulls and the bears. Now that we closed back down below the $207 area and the T-Line, that sets up the May 6 candle to be tested. The importance of the May 6 candle is that it tested the 23.6% Fibonacci line. And one thing for sure in the chart is that the price consolidation is causing both the 20- and 50-day simple moving averages to tighten up. The tighter they get the more likely a trend direction is to happen.
IYT, the Dow Jones Transportation Index, played hard yesterday and ended up in the nurse’s office closing with a classic blue ice failure and an accompanying bearish engulf on volume. IYT may put a drag on the overall market. Here at Hit-and-Run Candlesticks, we’ll be keeping a very close eye on it.
Trading knowledge ignites successful stock trading.
All the best to your trading success!
Rick
IWM: Daily chart |Above $112.41bullish | Below $110.98 weak
SMH: Daily chart |Above $52.63 bullish | Below $51.97 weak
IYT: Daily chart |Above $140.80 bullish | Below $138.70 weak
VIX: Daily chart | Above $14.27 bullish | Below $13.80 weak
USO: Daily chart | Above $11.14 bullish | Below $10.86 weak
UUP: Daily chart | Above $24.36 bullish | Below $24.26 weak
Each day 10 -15 stocks are posted in the members area that I believe are poised to move 10-20% (or more) within the next few days. Please follow your trading rules for entry stops and profits. Remember to check for earnings!
Members only
Keep your eye on the inverse ETF’s They trade well!
Investing and Trading involves significant financial risk and is not suitable for everyone. No communication or chat sessions should be considered as financial or trading advice. All information is intended for Educational Purposes Only.
To see all of today’s trade ideas Click Here
2-sma > T-Line™ = Minor trend up
T-Line™ > 34-ema = Intermediate trend up
2-sma < T-Line™ = Minor trend down
T-Line™ < 34-ema = Intermediate trend down
| Click Here | for members login | Trade Ideas & | House trade list |
| Bullish Above | Weak Below | |
| 30.35 | 29.18 | |
| 14.35 | 14.27 | |
| 41.05 | 40.66 | |
| 94.85 | 92.93 | |
| 120.41 | 119.70 | |
| 92.42 | 90.75 | |
| 213.63 | 207.97 | |
| 708.91 | 689.01 | |
| 13.44 | 13.28 |
VXX S&P 500 VIX Short Term Futures: A close above the T-Line ™ implies the bullish short-term swing traders are in control. A close below the T-Line ™ implies the bearish short-term swing traders are in control.
Energy Sector: XLE, SX90, ERX, USO A close above the T-Line ™ implies the bullish short-term swing traders are in control. A close below the T-Line ™ implies the bearish short-term swing traders are in control.
SMH: A close above the T-Line ™ implies the above short-term swing traders are in control. A close below the T-Line ™ implies the bearish short-term swing traders are in control.
IYT: A close above the T-Line ™ implies the above short-term bullish swing traders are in control. A close below the T-Line ™ implies the bearish short-term swing traders are in control.
US Dollar Index: UUP, DXYO A close above the T-Line ™ implies the bullish short-term swing traders are in control. A close below the T-Line ™ implies the bearish short-term swing traders are in control. Learn more about the T-Line – Click Here
The information in this email and Blog Post are notes to myself and should NOT be construed as financial or trading advice.
Investing and Trading involves significant financial risk. No communication should be construed as financial or trading advice. All information provided is for Educational Purposes Only.
Investing and Trading involves significant financial risk and is not suitable for everyone. No communication or chat sessions should be considered as financial or trading advice. All information is intended for Educational Purposes Only.
http://hitandruncandlesticks.com Trading for Profit is not an investment advisory service, nor a registered investment advisor or broker-dealer and does not tell or suggest which securities or currencies customers or subscriber should buy or sell. The analysts and employees or affiliates of Company may hold positions in the stocks, currencies or industries discussed here.


Comments are closed.