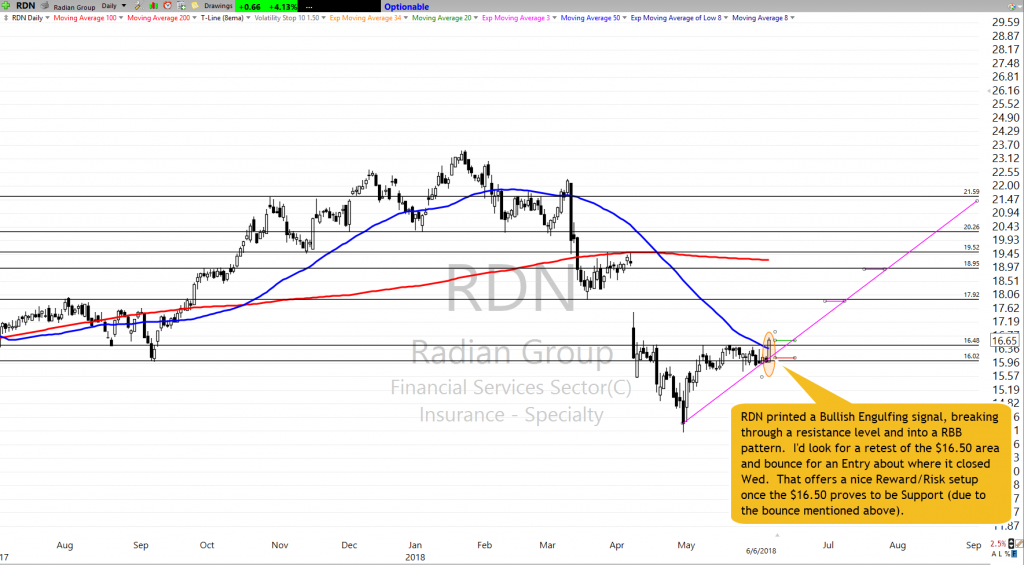
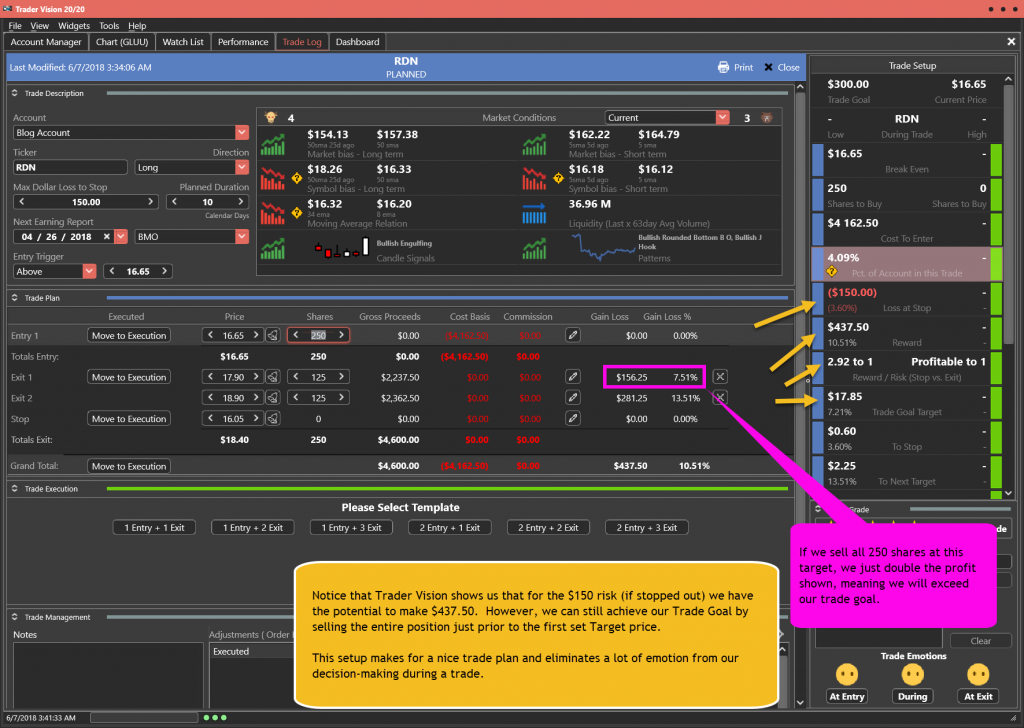
Today’s Featured Trade Idea is RDN. Wednesday it broke out of a resistance level and into an RBB pattern on a Bullish Engulfing signal. It has room to run overhead up to the next resistance and the resistance level broken yesterday as well as another level close below to act as support. On a retest of the $16.50 area and a bounce I’d look for an Entry near Wednesday’s Closing price, using the well-defined resistance levels above as potential target prices. The chart and trade plan are shown below. As a bonus, if you click the green button below, you’ll be able to watch a video of the chart markup and trade planning process.
For a more detailed analysis of the ticker, refer to Rick’s Public Stock Trade Idea for today…or, of course, members can listen to his detailed analysis in the trading room at 9:10am Eastern.
However, for now, here is my analysis and a potential trade plan made using our Trader Vision 20/20 software.
The RDN Trade Setup – As of 6-6-18

The RDN Trade Plan

Note how Trader Vision 20/20 does so much of the work for you. As the arrows above show, with Trader Vision, not only do we know exactly how much money is at risk (if stopped out), but also the reward dollars and Reward/Risk Ratio at each Target price as we plan a trade. We can also see the price the stock must reach in order for us to meet our trade goal. Having all this information ahead of time takes the pressure off during a trade. We know the risk, the potential reward and the levels (Stop and Target) where we’re going to be exiting the trade. No guesswork or emotional roller coaster involved!
To see a short video of this trade’s chart markup and trade planning, click the button below.
[button_2 color=”light-green” align=”center” href=”https://youtu.be/wn3z7WPiJ2Q” new_window=”Y”]Trade Plan Video[/button_2]
If you’re interested in putting the power to Trader Vision 20/20 to work for you, click below.
[button_2 color=”orange” align=”center” href=”https://hitandruncandlesticks.com/product/trader-vision-20-20-monthly-subscription2/” new_window=”Y”]TV20/20 Software[/button_2]
Last chance! Act now to
Save your seat for Thursday’s session.
Trading With Fibonacci Retracements/Extensions
6/7/18 at 8pm Eastern
- Why do Fib Ratios Work?
- Why Should You Use Extensions instead of Projections?
- Answers to Common Problems Using Fibs.
- Where do you begin and end your drawing?
- Do we use Bodies or Wicks?
- Which Ratios should be your focus?
- How to Identify the major support/resistance Levels with Fibs?
- How to Find Entries with Fib Retracements?
- How to Set Targets Using Fib Extensions?
[button_2 color=”red” align=”center” href=”https://ob124-cea4cb.pages.infusionsoft.net/” new_window=”Y”]Fibonacci Retracement An Extensions Workshop • Click To Learn More[/button_2]
Testimonial
This is not your usual service that sends out a ton of stock recommendations, and then cherry picks the winners to show you how great they are. Hit and Run Candlesticks and Right Way Options are truly educational services. They taught me how to trade not what to trade. The entire team: Rick, Doug, Steve, and Ed are there to help and answer your questions. They are awesome. They cut years off my learning curve. And it’s a team effort. Everyone in the room (all the members) are there to help with invaluable insights and advice. The only service you will ever need. Thanks to all the team for how you have helped me and for all you do. –Jonathan Bolnick
***************************************************************************************************
Investing and Trading involve significant financial risk and are not suitable for everyone. Ed Carter is not a licensed financial adviser nor does he offer trade recommendations or investment advice to anyone. No communication from Hit and Run Candlesticks Inc. is to be considered financial or trading advice. All information is intended for Educational Purposes Only. Terms of Service.
***************************************************************************************************


Comments are closed.