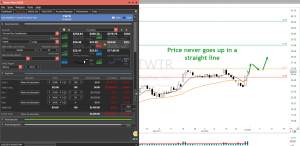
TWTR Found Buyers at Support
 TWTR had a little trouble recently on the challenge of the $25.50 area, and the sellers seem to have won. TWTR found buyers at support near the 50-SMA. The buyers have come back with a Bullish Morning Star pattern and follow through closing above the T-Line. Over the next few days we will be watching for a breakout, test and a buy signal (BTB) TWTR is a bullish chart and a Bullish buy over $25.75 with a qualified buy signal.
Learn more about my trading tools join me in the trading room or consider Private Coaching. Rick will help coach you to trading success. Today At 9:10 AM ET. We will demonstrate live how TWTR could be traded using our Simple Proven Swing Trade Tools
► Learn the Power Of Simple Trading Techniques
On January 29, Rick shared NTLA as a trade for members to consider and how to use the trading tools listed below. Currently, the profits would have been about 8.5% or $210.00 with 100 shares. Using our Simple, Proven Swing Trade Tools and techniques to achieve swing trade profits.
Candlesticks • Price Action T-Line • T-Line Bands • Support • Resistance • Trendlines • Chart Patterns • Buy Box • Volatility Stops • Profit Zones • Entry Zones • Protective Stops • RBB Rounded Bottom Breakout Strategy • Pop Out of The Box Strategy • Pinball Strategy • Continuation Patterns • Trade Planning… Learn More
► Eyes On The Market
The SPY held the T-Line at the close yesterday but with a Bearish Harami stupidity overbought. The VXX was up and held the bullish link into the close as well; the clue is to be cautious and not blindly bullish as so many traders are in recent days. In the trading room yesterday we spoke of the $268.00 line if the price gets below we will likely see a test of the T-Line, the first time in 19 days.
The Transports ETF (IYT) has lost the T-Line, and I suspect a few other important ETF’s will lose the T-Line today.
The VXX short-term futures closed above the 50-SMA yesterday headed toward our first profit zone on about $31.00 depending on price action we may or may not pull profits.
Rick’s Swing Trade ideas
Member Login – Full Daily List
30-Day Trial • Monthly • Quarterly • Semi-Annual • Annual
Candlesticks • Price Action T-Line • T-Line Bands • Support • Resistance • Trendlines • Chart Patterns • Buy Box • Volatility Stops • Profit Zones • Entry Zones • Protective Stops • RBB Rounded Bottom Breakout Strategy • Pop Out of The Box Strategy • Pinball Strategy • Continuation Patterns
Investing and Trading involve significant financial risk and is not suitable for everyone. No communication from Hit and Run Candlesticks Inc. is financial or trading advice. All information is intended for Educational Purposes Only. Terms of Service.
Rick Saddler is not a licensed financial adviser nor does he offer trade recommendations or advice to anyone except for the trading desk of Hit and Run Candlesticks Inc.
*************************************************************************************


Comments are closed.