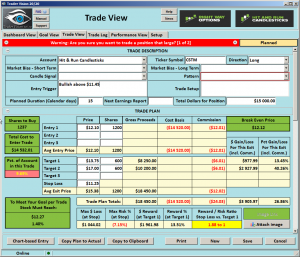
CSTM – Bullish Above 11.45
 CSTN (Constellium NV), The CSTM Chart has consolidated for the past couple of months and is now Bullish above $11.45. Last week CSTM broke out and closed above a double top after finding support from the 34-EMA and 50-SMA. On a 2-Day chart of CSTM, you can see the Ascending Triangle and the Bullish Engulf.
If you need coaching on setting up your trade plan Click Here
►Train Your Eyes
CSTM • Trend • Ascending Triangle •Rising 34-EMA • Bullish Engulf • (Hit: Look at a 2-day chart)
Good Trading – Hit and Run Candlesticks
► Ticker Update (ALGN)
You could have profited more than 35% or about $6100.00, with 100 shares when we posted to our members on August 8. If you are interested contact • Coaching With Rick
► Eyes On The Market
Friday ended on a Bullish note with the SPY printing a Bullish J-Hook Continuation pattern. (The 2-Day chart printed a Bullish Morning Star). Price vs-Line and T-Line Bands are bullish, price vs. price is bullish, price vs. V-Stop is bullish. I would say the market is bullish. Below $255.60 or about the T-Line would bring the VIX up a little. The VIX closed below the Lower T-Line Band and below the VStop but support and bottom construction are still evident.
Rick’s trade ideas for the day – MEMBERS ONLY
30-Day Trial • Monthly • Quarterly • Semi-Annual • Annual
Investing and Trading involves significant financial risk and is not suitable for everyone. No communication from Hit and Run Candlesticks Inc. is financial or trading advice. All information is intended for Educational Purposes Only. Terms of Service.
Rick Saddler is not a licensed financial adviser nor does he offer trade recommendations or advice to anyone except for the trading desk of Hit and Run Candlesticks Inc.


Comments are closed.