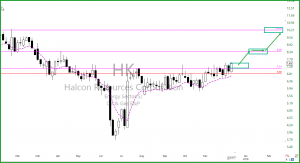
Watching The 3-Day Chart
 HK – I am watching the 3-day chart starting with the candle on July 12. The chart pattern from July 12 has floated sideways with support around $5.80. Then on November 2, a little upward trend started. Now support has kicked up a little to about $5.60. Notice how the 34-EMA has risen above the 200-SMA
At 9:10 AM ET. We will talk about the technical properties of HK with target zones, a couple of logical entries and a protective stop. We will also be showing our trade plan with risk/reward and expected profits.
►Subscribing Members log in
To the member’s area for the Trader Vision Trade Plan that we have created for ourselves.
► Must Read Trade Update (TRLD)
On August 31, we shared and covered in detail the technical properties of TLRD in the Trading Room, Friday the profits were about 64.20% or $764.00, with 100 shares. TLRD broke out of out (RBB Pattern) and continued the trend with minor pullback opportunities (PBO). Moving the stop up to about $18.85 would make sense.
[button_2 color=”orange” align=”center” href=”https://ob124.infusionsoft.com/app/orderForms/HRC-Hit–Run-Candlesticks-30-day-Trial-1497″ new_window=”Y”]30-Day Trial Hit and Run Candlesticks • Earn While You Learn[/button_2]► Eyes On The Market
The SPY was able to rise off the T-Line last week and close Bullish. On the daily chart, a Bullish J-Hook Continuation pattern is forming, A close above $266.38 would confirm the Bullish J-Hook Pattern. Sometimes it’s hard to make sense of a grouping of candles on a daily chart, so you might want to look at a higher time frame. Take a look at the 4-day chart; you can see a bullish Doji Continuation Patter formed. The bulls simply need to follow through and stacking.
Rick’s trade ideas for the day – MEMBERS ONLY
30-Day Trial • Monthly • Quarterly • Semi-Annual • Annual
Learn how and what we trade: The T-Line • T-Line Bands • Chart Patterns • Support • Resistance • Patterns • Buy Box • Volatility Stops • Price Action • Candlesticks • Profit Zones • Entry Zones • Protective Stops
Investing and Trading involves significant financial risk and is not suitable for everyone. No communication from Hit and Run Candlesticks Inc. is financial or trading advice. All information is intended for Educational Purposes Only. Terms of Service.
Rick Saddler is not a licensed financial adviser nor does he offer trade recommendations or advice to anyone except for the trading desk of Hit and Run Candlesticks Inc.
*************************************************************************************


Comments are closed.