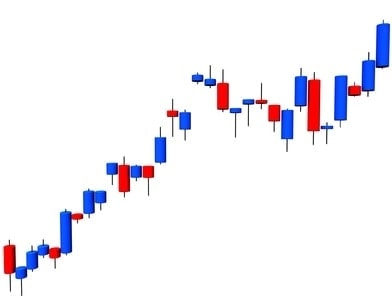
Last week we discussed the very basics of candlestick charts: what candlesticks look like, what their shape conveys, and how you can begin to understand them. Today we’d like to take that lesson one step further. Now that you can interpret a candlestick’s meaning, let’s talk about the various formations and patterns you’ll encounter in candlestick charts and what they suggest. Understanding candlestick charts (both the logistics and complexities) will take some time, so for now, we’re sticking with the basics. Let’s get started!
Understanding Candlestick Charts
The Basic Formations and Patterns
Spinning Tops
If a candlestick has a short body and the upper and lower wick are both long, the candlestick is known as a spinning top. Just as a top spins and wavers, a spinning top represents indecision but also action. Because the body is small, you know that the price didn’t move much from open to close. However, since the shadows are long, you can see that the prices jumped around during the session. Bottom line: little movement but lots of action!
Long-Legged Doji
Similar in shape and message to spinning tops, long-legged doji are doji with lengthy wicks on both top and bottom. They also convey indecision, showing that the prices varied throughout the session but when it closed, they were virtually even with the opening price. Indecisive and leggy, this pattern could be the fraternal twin of a spinning top.
Long White Candle and a Doji
What does it mean when you see a little doji appear after the formation of a long white candlestick? Typically, this pattern signals that buying pressure is decreasing and the uptrend should end soon. Wait for bearish confirmation (a gap down, a long black candlestick, etc.) to confirm this pattern’s meaning, and keep your eyes on the sky to search for evening doji stars.
Long Black Candle and a Doji
When a long black candle is followed by a doji, the opposite has been indicated: selling pressure is decreasing and the downtrend should end soon. Again, you should confirm your finding, this time with a bullish confirmation (a gap up, a long white candlestick, etc). Watch for the appearance of a morning doji star.
Dragon Fly Doji
A dragon fly doji is shaped like a tall, capital T. This happens when the open and close are equal, and the lower wick is casting a long shadow. The formation shows that sellers were in control during the session, driving down the prices. However, by the end, the buyers had pushed the price back up.
Gravestone Doji
Flip a dragon fly doji on its head and you’ve got a gravestone doji! The gravestone doji looks like long, upside down, capital T. When you spot it, you know the opposite interpretation is true: buyers dominated the session, but by the end, sellers had pushed the price back to its original place.
It will take some time for you to recognize these patterns consistently, but be patient. With a little time and some studying, you will soon know how to recognize and use candlestick patterns and positions. Good luck!
If you’re interested in mastering some simple but effective swing trading strategies using Japanese candlesticks, be sure to check out Hit & Run Candlesticks. Our methods are simple, yet powerful. We look for stocks positioned to make an unusually large percentage move, using high percentage profit patterns as well as powerful Japanese candlesticks.


Comments are closed.