T-Line Low Supports Pullback
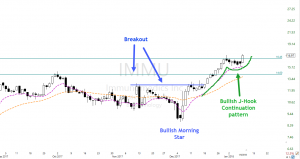
 IMMU has had a beautiful bullish run from early December breaking out of the October high. The sellers printed a Shooting Star, and price action followed for six straight days. Yesterday after meeting up with the T-Line Low price fought back by closing up 8.23% and creating a bullish J-Hook continuation pattern. Over $16.45 could trigger more buyers. We have added IMMU to our watchlist for consideration.
At 9:10 AM ET. We will demonstrate how IMMU was chosen using our Simple Proven Swing Trade Strategies
Simple Proven Swing Trade Tools
Candlesticks • Price Action • T-Line • T-Line Bands • Support • Resistance • Trendlines • Chart Patterns • Buy Box • Volatility Stops • Profit Zones • Entry Zones • Protective Stops • RBB Rounded Bottom Breakout Strategy • Pop Out of The Box Strategy • Pinball Strategy • Continuation Patterns • Trade Planning
► Learn From The Chart (WTW)
On December 26, we shared, in detail, the technical chart properties of WTW in our members Trading Room and why we thought this chart was ready for a run. Yesterday the profits would have been about 13.50% or $685.00 with 100 shares. Using our simple, proven Swing Trade tools and techniques to achieve swing trade profits.
► Eyes On The Market (Caution Caution Caution)
Six days up is more than this horse can take. The SPY has moved higher the past six days a little faster than it can handle and is now in need of a rest. As I mentioned in last nights e-Learning webinar, the market is primed for a profit taking and the morning futures are pointing this out. The main trend is still up, and as of yet, support has not been broken. I suspect we see the sellers challenge the $271.70 area and then we can get a better idea of what price action is up to.
The VXX short-term futures printed a Bullish Egulf yesterday, and today it will likely test the T-Line Band High. A close over the T-Line Band High would indicate that fear is heating up and that would be a first step in creating a bullish bottom in the VXX chart.
Rick’s Swing Trade ideas – MEMBERS remember to log into the members’ blog for the trade ideas – Member Login
30-Day Trial • Monthly • Quarterly • Semi-Annual • Annual
T-Line • T-Line Bands • Support • Resistance • Trendlines • Chart Patterns • Buy Box • Volatility Stops • Profit Zones • Entry Zones • Protective Stops • RBB Rounded Bottom Breakout Strategy • Pop Out of The Box Strategy • Pinball Strategy • Continuation Patterns • Trade Planning
Investing and Trading involves significant financial risk and is not suitable for everyone. No communication from Hit and Run Candlesticks Inc. is financial or trading advice. All information is intended for Educational Purposes Only. Terms of Service.
Rick Saddler is not a licensed financial adviser nor does he offer trade recommendations or advice to anyone except for the trading desk of Hit and Run Candlesticks Inc.
*************************************************************************************


Comments are closed.