
Rick’s Featured Trade Ideas
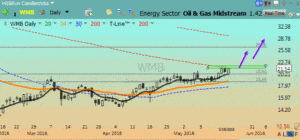 WMB/LONG |RBB| Bullish Engulf | T-Line™ Bounce | H’er Highs and H’er Lows
WMB| Plan your trade & trade your plan | May 20, 2016
Possible entry plan idea: Buy box $21.54- $22.14
Possible stop plan idea: Protective below $21.54
Swing trade playground: $21.62- $29.85=38%
Playground risk reward: 17:1 + depending on | entry | exit | stop
SPY: T-Line ™ chart suggest the sellers are in control.
7:00 am: Bounce | Relief rally likely today
The SPY has been trending down since the Bearish Evening Star April 20. With a series of lower lows and lower highs, yesterday’s trading closed down .35% and closed with a lower low Doji. As I mentioned yesterday in the trading room and at last night’s webinar a bounce/relief rally is very likely today. The $207 level is still very important for the Bulls to gain back and important for the bears to defend. Because of the recent lower lows there is another strategic level that the Bulls need to take back ($207.75) Which would also challenge the upper trend-line if the attack was within the next few trading days.
As of the close yesterday the only S&P spider select ETF over the T-Line™ was energy ETF (XLE) and it was not overly impressive.
Trading knowledge ignites successful stock trading.
All the best to your trading success!
Rick
IWM: T-Line™ chart |Trending down | below T-Line™
SMH: T-Line™ chart |Above 53.28 could prove bullish
IYT: T-Line™ chart |Trending down | Bear Flag
VIX: T-Line™ chart | Trending up |Above 16.08 will keep the fear going
USO: T-Line™ chart | Trending up | Price, T-Line™ Duce are in battle
UUP: T-Line™ chart | Relief rally under way | PBO soon
Each day 10 -15 stocks are posted in the members area that I believe are poised to move 10-20% (or more) within the next few days. Please follow your trading rules for entry stops and profits. Remember to check for earnings!
Members Only
Keep your eye on the inverse ETF’s They trade well!
Investing and Trading involves significant financial risk and is not suitable for everyone. No communication or chat sessions should be considered as financial or trading advice. All information is intended for Educational Purposes Only.
To see all of today’s trade ideas Click Here
2-sma > T-Line™ = Minor trend up
T-Line™ > 34-ema = Intermediate trend up
2-sma < T-Line™ = Minor trend down
T-Line™ < 34-ema = Intermediate trend down
| Click Here | for members login | Trade Ideas & | House trade list |
| Bullish Above | Weak Below | |
| 12.60 | 12.00 | |
| 14.34 | 14.07 | |
| 43.15 | 41.26 | |
| 93.80 | 92.40 | |
| 119.20 | 118.10 | |
| 93.24 | 91.40 | |
| 213.73 | 207.33 | |
| 701.75 | 689.00 | |
| 13.55 | 13.40 |
VXX S&P 500 VIX Short Term Futures: A close above the T-Line ™ implies the bullish short-term swing traders are in control. A close below the T-Line ™ implies the bearish short-term swing traders are in control.
Energy Sector: XLE, SX90, ERX, USO A close above the T-Line ™ implies the bullish short-term swing traders are in control. A close below the T-Line ™ implies the bearish short-term swing traders are in control.
SMH: A close above the T-Line ™ implies the above short-term swing traders are in control. A close below the T-Line ™ implies the bearish short-term swing traders are in control.
IYT: A close above the T-Line ™ implies the above short-term bullish swing traders are in control. A close below the T-Line ™ implies the bearish short-term swing traders are in control.
US Dollar Index: UUP, DXYO A close above the T-Line ™ implies the bullish short-term swing traders are in control. A close below the T-Line ™ implies the bearish short-term swing traders are in control. Learn more about the T-Line – Click Here
The information in this email and Blog Post are notes to myself and should NOT be construed as financial or trading advice.
Investing and Trading involves significant financial risk. No communication should be construed as financial or trading advice. All information provided is for Educational Purposes Only.
Investing and Trading involves significant financial risk and is not suitable for everyone. No communication or chat sessions should be considered as financial or trading advice. All information is intended for Educational Purposes Only.
http://hitandruncandlesticks.com Trading for Profit is not an investment advisory service, nor a registered investment advisor or broker-dealer and does not tell or suggest which securities or currencies customers or subscriber should buy or sell. The analysts and employees or affiliates of Company may hold positions in the stocks, currencies or industries discussed here.


Comments are closed.