
Rick’s Featured Trade Ideas
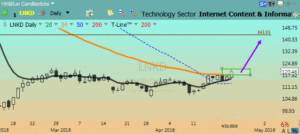
LKND/Long (Internet Content) Rising T-Line™ | Bullish Flag | RBB Pattern | DBL Bottom | Scoop Pattern
LKND| Plan your trade & trade your plan | April 22, 2016
Possible entry plan idea: Buy box $118.00- $122.00
Possible stop plan idea: Protective stop below $118.02
Swing trade #1 playground: $118.00 – $143.90
Playground risk reward: 13:1 + depending on | entry | exit | stop
 SPY: Short Term Signaling a Warning
7:00 am: Yesterday closed with a BEARISH EVENING STAR which suggests a lower open today (this was discussed in the trading room before the bell yesterday afternoon). In yesterday’s morning blog post, we mentioned that a close below $208.99 would be Warning #1. Yesterday the SPY closed at $208.97– Warning #1. We also wrote if a close below $207.00 followed, that would be Warning #2.
With poor earnings from a few big names yesterday, we are likely to see and feel a little disturbance in the force this morning, and it may or may not carry over to the close.
The BEARISH EVENING STAR signal from yesterday is another warning sign. Overall, the trend is still bullish and the support area still looks good; it’s the short term that’s iffy. If the bulls take another run at the highs, we will know by the clues from price action – Candlesticks.
IWM: 30-min chart |T-Line™ broke the 34-ema
SMH: 30-min chart |Broke below my intraday deuces | I have been talking poorly about SMH for a few days now.
IYT: 30-min chart | Keep an eye on those intraday deuces.
S&P VIX Short-Term Futures VXX: 30-min chart | T-Line™ above the 34-ema
USO Unites States Oil Fund: Daily chart | Bullish trend still in play | Doji yesterday
Each day 10 -15 stocks are posted in the members area that I believe are poised to move 10-20% (or more) within the next few days. Please follow your trading rules for entry stops and profits. Remember to check for earnings!
Keep your eye on the inverse ETF’s They trade well!
Members Only
Investing and Trading involves significant financial risk and is not suitable for everyone. No communication or chat sessions should be considered as financial or trading advice. All information is intended for Educational Purposes Only.
To see all of today’s trade ideas Click Here
2-sma > T-Line™ = Minor trend up
T-Line™ > 34-ema = Intermediate trend up
2-sma < T-Line™ = Minor trend down
T-Line™ < 34-ema = Intermediate trend down
| Click Here | for members login | Trade Ideas & | House trade list |
| Bullish Above | Bearish Below | |
| 26.93 | ||
| 15.15 | 14.73 | |
| 39.88 relief rally | ||
| 62.88 | 58.80 | |
| 108.13 | ||
| 112.80 | 109.20 | |
| 99.36 | ||
| 194.77 | ||
| 258.25 | 245.52 | |
| 633.75 | 620.79 | |
| 87.35 | ||
VXX S&P 500 VIX Short Term Futures: A close above the T-Line ™ implies the bullish short-term swing traders are in control. A close below the T-Line ™ implies the bearish short-term swing traders are in control.
Energy Sector: XLE, SX90, ERX, USO A close above the T-Line ™ implies the bullish short-term swing traders are in control. A close below the T-Line ™ implies the bearish short-term swing traders are in control.
SMH: A close above the T-Line ™ implies the above short-term swing traders are in control. A close below the T-Line ™ implies the bearish short-term swing traders are in control.
IYT: A close above the T-Line ™ implies the above short-term bullish swing traders are in control. A close below the T-Line ™ implies the bearish short-term swing traders are in control.
US Dollar Index: UUP, DXYO A close above the T-Line ™ implies the bullish short-term swing traders are in control. A close below the T-Line ™ implies the bearish short-term swing traders are in control. Learn more about the T-Line – Click Here
The information in this email and Blog Post are notes to myself and should NOT be construed as financial or trading advice.
Investing and Trading involves significant financial risk. No communication should be construed as financial or trading advice. All information provided is for Educational Purposes Only.
Investing and Trading involves significant financial risk and is not suitable for everyone. No communication or chat sessions should be considered as financial or trading advice. All information is intended for Educational Purposes Only.
http://hitandruncandlesticks.com Trading for Profit is not an investment advisory service, nor a registered investment advisor or broker-dealer and does not tell or suggest which securities or currencies customers or subscriber should buy or sell. The analysts and employees or affiliates of Company may hold positions in the stocks, currencies or industries discussed here.


Comments are closed.