Price Below the Upper T-Line Band is a Warning
(SPY) – Price below the Upper T-Line Band is a warning, price below the Lower T-Line Band is a clue the Bears out number the Bulls. On May 11 I wrote, “ Last Weeks-Channel Looking to Get Tested I put the top channel line about $238.80 and the bottom about $237.70.”
Yesterday the sellers were a mission to drive the price lower. However, the Bulls rallied back on a Tweezer Bottom closing the day with a Hammer at $239.38. Candlestick tip: Hammers require confirmation. Bases on the early morning numbers it looks like we are going to open inside the T-Line Bands and inside the Hammer handle.
Yesterday WAC gave an early morning entry then rallied 19%, WAC took out 2 of our targets.
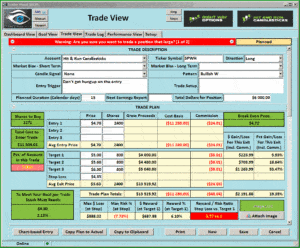
FREE Trade Idea – SPWH
SPWH Has been constructing a reversal bottom for the past two months. This week SPWH broke out of a Bullish “W” pattern and Wednesday it became a Bullish Rounded Bottom Breakout. Traded and managed correctly I see a possible 20% plus trade.
 [button_2 color=”light-green” align=”center” href=”https://hitandruncandlesticks.com/hrc-rwo-30-day-offer/” new_window=”Y”]30-Day Trial to Hit and Run Candlesticks Click Here[/button_2]
What is a Trade Idea Watch List?
A trade idea watch list is a list of stocks that we feel will move in our desired direction over a swing trader’s time frame. That time could be one to 15 days for example. From that watch-list, we wait until price action meets our conditions for a trade.
Investing and Trading involve significant financial risk and is not suitable for everyone. No communication from Hit and Run Candlesticks Inc. is not financial or trading advice. All information is intended for Educational Purposes Only. Terms of Service


Comments are closed.