Plenty Bullish Charts With Solid Bullish Continuation Patterns
(SPY) – One thing is for sure; there are plenty bullish charts with solid bullish continuation patterns. RBB’s, mini cups and Handles, Flags, PBO’s, trends with pull back to support
Price action has rallied back above the T-Line and the upper T-Line Band. Bulls seem determined to keep the price from dropping. Between today, Wednesday of Thursday we should see a pullback to retest some of the recent 3-day moves.
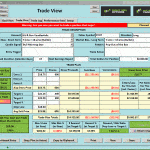
FREE TRADE IDEA – SYNT
 SYNT has walked into one of our RBB traps. And now above the lower resistance. Price is forming a POP out of the box price formation on the 1, 2, and 3-day charts. The dotted deuce and the deuce are overhead.
Take a look at the 2 and 3-day chart too, they can be very helpful. A tonight’s training workshop ask me about one of my tricks to managing a chart once in it.
Did You Know
AAOI was a members trade idea on May 5? The trade was simple, recognize the breakout, buy the Doji Continuation pattern. Set your stop and let the chart work.
100 Shares and you would be up $1528 at yesterday’s close
With on-demand recorded webinars, eBooks, and videos, member and non-member eLearning, plus the Live Trading Rooms, there is no end your education. Start small and learn
What are you doing this Summer? 3 months of summer could change your life forever!
- Would you like to learn – How to find the charts to trade that create a second income?
- Would you like to learn – How to manage trades for $100, $250, $500, a week?
- Would you like to do this just a few hours a day?
Hit and Run Candlesticks can help you with this for $70.83 per month / 3 months $212.50 / $212.50 to learn something you get to keep, something that could change your live forever.
[button_2 align=”center” href=”https://ob124.infusionsoft.com/app/orderForms/Membership—Hit-and-Run-Candlesticks—Quarterly” new_window=”Y”]Extra Income | Take e Month To Learn | Only $212.50[/button_2]
What is a Trade Idea Watch List?
A trade idea watch list is a list of stocks that we feel will move in our desired direction over a swing trader’s time frame. That time could be one to 15 days for example. From that watch-list, we wait until price action meets our conditions for a trade.
Investing and Trading involve significant financial risk and is not suitable for everyone. No communication from Hit and Run Candlesticks Inc. is not financial or trading advice. All information is intended for Educational Purposes Only. Terms of Service.
Rick Saddler is not a licensed financial adviser nor does he offer trade recommendations or advise to anyone except for the trading desk of Hit and Run Candlesticks Inc.


Comments are closed.