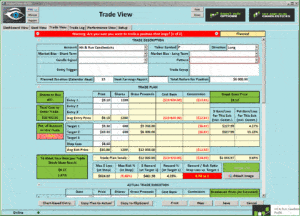
P Is Building A J-Hook Continuation Pattern
 (Pandora Media Inc) $P is building a J-Hook continuation pattern after a 8 day run to the 50-sma. The pullback ended with a Bullish Engulf, the follow through ended yesterday with a Doji, now creating a Doji Continuation pattern. Other patterns and signal involved are Inverse Head and Shoulder, POB to the 38% Fib line. 2-day chart is supporting a Bullish Morning Star Signal
Learn more about Hit and Run Candlesticks, and today’s trade idea plus the 10 or more members trade ideas, starting at 9:10 EST AM every morning. Every day we teach and trade using the T-Line, Candlesticks, Support and Resistance, Trends, chart patterns and continuation patterns.
We are still holding ARDX 22.64% profit
Education on how to manage a trade from start to finish is vital to a swing traders success.
With on-demand recorded webinars, eBooks, and videos, member and non-member eLearning, plus the Live Trading Rooms, there is no end your trading education here at the Hit and Run Candlestick, Right Way Option, Strategic Swing Trade Service and Trader Vision.
[button_1 text=”%2485.00%20a%20Month%20Cancel%20Anytime%20-%20Keep%20what%20you%20learn%20and%20you%20will%20learn%20a%20lot” text_size=”27″ text_color=”#000000″ text_bold=”Y” text_letter_spacing=”0″ subtext_panel=”Y” subtext=”Take%20A%20Look” subtext_size=”19″ subtext_color=”#f40606″ subtext_bold=”Y” subtext_letter_spacing=”0″ text_shadow_panel=”N” styling_width=”40″ styling_height=”30″ styling_border_color=”#000000″ styling_border_size=”1″ styling_border_radius=”6″ styling_border_opacity=”100″ styling_shine=”Y” styling_gradient_start_color=”#ffff00″ styling_gradient_end_color=”#ffa035″ drop_shadow_panel=”N” inset_shadow_panel=”N” align=”center” href=”https://hitandruncandlesticks.com/hit-and-run-candlesticks/” new_window=”Y”/]
$SPWR was first presented to HRC members on May 31
Now up 24.66%. And popped 12.39% yesterday. SPWR was a Rounded Bottom Breakout and nailed it by the numbers on the daily chart. The 2-day chart is still a Rounded Bottom Breakout pattern, and it looks like another 25% is in the sun.
Eyes On The Market
Yesterday the market loved everything about Miss Janet, will today be the same? Price gapped and held above the downtrend line on the SPY turning the T-Line back up. Stay cautious and let’s make money.
What is a Trade Idea Watch-list?
A trade idea watchlist is a list of stocks that we feel will move in our desired direction over a swing trader’s time frame. That time could be one to 15 days for example. From that watchlist, we wait until price action meets our conditions for a trade.
MEMBERS ONLY
Investing and Trading involve significant financial risk and are not suitable for everyone. No communication from Hit and Run Candlesticks Inc. is financial or trading advice. All information is intended for Educational Purposes Only. Terms of Service.
Rick Saddler is not a licensed financial adviser nor does he offer trade recommendations or advice to anyone except for the trading desk of Hit and Run Candlesticks Inc.


Comments are closed.