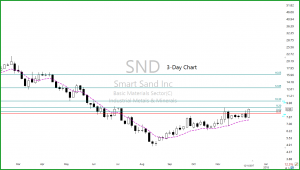
Looking At The 3-Day Chart
 SND – The Bullish trend started in mid-August3. Looking at the 3-day chart price action is being supported by the September highs, the last 7 bars (3-day chart) has painted a Pop Out of The Box pattern. Bullish over $8.60 with profit target zones above.
At 9:10 AM ET. We will talk about the technical properties of SND with target zones, a couple of logical entries and a protective stop. We will also be showing our trade plan with risk/reward and expected profits.
►Subscribing Members log in
To the member’s area for the Trader Vision Trade Plan
► Must Read Trade Update (EYES)
On December 4, we shared and covered in detail the technical properties of EYES in the Trading Room, Yesterday the profits were about 47% or $500.00, with 800 shares. EYES has been creating a bottom, after breaking out ran to the next profit zone. The PBO Bullish Engulf on December 1 kicked off the run.
[button_1 text=”Monthly%20Membership%20Only%2085.00″ text_size=”32″ text_color=”#000000″ text_bold=”Y” text_letter_spacing=”0″ subtext_panel=”Y” subtext=”Start%20Now%20%E2%80%A2%20Cancel%20Anytime” subtext_size=”18″ subtext_color=”#0c23e4″ subtext_bold=”Y” subtext_letter_spacing=”0″ text_shadow_panel=”N” styling_width=”40″ styling_height=”30″ styling_border_color=”#000000″ styling_border_size=”1″ styling_border_radius=”6″ styling_border_opacity=”100″ styling_shine=”Y” styling_gradient_start_color=”#ffff00″ styling_gradient_end_color=”#ffa035″ drop_shadow_panel=”N” inset_shadow_panel=”N” align=”center” href=”https://hitandruncandlesticks.com/hit-and-run-candlesticks/” new_window=”Y”/]► Eyes On The Market
The SPY has worked hard to overcome the Bearish Engulf on December 4 and has done a great job. The recent pullback used the V-Stop, and the T-Lines have continued to trend. The 4-day chart has painted a Bullish Doji continuation pattern. As of the close, yesterday price action still suggests bullishness. The VXX short-term futures are trending down below the V-Stop and the Lower T-Line Band.
Rick’s trade ideas for the day – MEMBERS ONLY
30-Day Trial • Monthly • Quarterly • Semi-Annual • Annual
Learn how and what we trade: The T-Line • T-Line Bands • Chart Patterns • Support • Resistance • Patterns • Buy Box • Volatility Stops • Price Action • Candlesticks • Profit Zones • Entry Zones • Protective Stops
Investing and Trading involves significant financial risk and is not suitable for everyone. No communication from Hit and Run Candlesticks Inc. is financial or trading advice. All information is intended for Educational Purposes Only. Terms of Service.
Rick Saddler is not a licensed financial adviser nor does he offer trade recommendations or advice to anyone except for the trading desk of Hit and Run Candlesticks Inc.
*************************************************************************************


Comments are closed.