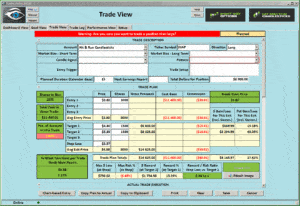
INAP Has Printed A Doji Continuation Pattern
 (Internap Corp) INAP Has Printed A Doji Continuation Pattern after breaking out of price action resistance and the big 3 moving averages. The past week or so INAP been in a tight consolidation with a bullish breakout (This is a Pop Out of The Box Pattern). On the 3-day chart, you can see an RBB setup coming off the dotted deuce turning up to the 200-sma. Learn more about Hit and Run Candlesticks, and today’s trade idea plus the 10 or more members trade ideas, starting at 9:10 EST AM every morning. 30-Day Trial
With on-demand recorded webinars, eBooks, and videos, member and non-member eLearning, plus the Live Trading Rooms, there is no end your trading education here at the Hit and Run Candlestick, Right Way Option, Strategic Swing Trade Service and Trader Vision.
Yesterday We Closed IMGN for an 18% Profit
[button_1 text=”%241000%20invested%20in%20IMGN%20at%2018%25%20is%20%241180.” text_size=”32″ text_color=”#000000″ text_bold=”Y” text_letter_spacing=”0″ subtext_panel=”Y” subtext=”Try%20Us%20Out%201-Month” subtext_size=”22″ subtext_color=”#3542f8″ subtext_bold=”Y” subtext_letter_spacing=”0″ text_shadow_panel=”N” styling_width=”40″ styling_height=”30″ styling_border_color=”#000000″ styling_border_size=”1″ styling_border_radius=”6″ styling_border_opacity=”100″ styling_shine=”Y” styling_gradient_start_color=”#ffff00″ styling_gradient_end_color=”#ffa035″ drop_shadow_panel=”N” inset_shadow_panel=”N” align=”center” href=”https://hitandruncandlesticks.com/hit-and-run-candlesticks/” new_window=”Y”/]
AGEN was first presented to HRC members on July 5,
Now up 12%. The Rounded Bottom Breakout pattern brings money to the table again. After a few bars of consolidation, a 9% pop close AGEN over the dotted deuce. Double-digit target ahead.
Eyes On The Market
For the most part, the market has been walking around looking for a path but can’t seem to find it. There is not a candle signal or pattern that’s giving a clue to the next market direction. For now, we will remain in mostly long positions a few short.
The overall market remains vulnerable as the Bear works for more control. As of the close Friday, I feel the Bull still has control, and the Bear has been a pain in you know what. On the SPY, DIA, and IWM charts the T-Line is still in bullish territory, The T-Line on the QQQs have slipped below itself.
What is a Trade Idea Watch-list?
A trade idea watchlist is a list of stocks that we feel will move in our desired direction over a swing trader’s time frame. That time could be one to 15 days for example. From that watchlist, we wait until price action meets our conditions for a trade.
MEMBERS ONLY
Investing and Trading involve significant financial risk and are not suitable for everyone. No communication from Hit and Run Candlesticks Inc. is financial or trading advice. All information is intended for Educational Purposes Only. Terms of Service.
Rick Saddler is not a licensed financial adviser nor does he offer trade recommendations or advice to anyone except for the trading desk of Hit and Run Candlesticks Inc.


Comments are closed.