
Last Updated: December 30, 2016
Looking for a bull? Think you’ve spotted a bear? In either case, you might need to learn about the Harami candlestick pattern. It comes in two different varieties: the bearish reversal pattern (which occurs after an uptrend) and the bullish reversal pattern (which occurs after a downtrend). This common candlestick signal is also very easy to spot. To learn how to identify the Harami, the differences between bullish and bearish varieties, and what the Harami candlestick pattern signifies, please scroll down . . .
Harami Candlestick Pattern
Formation
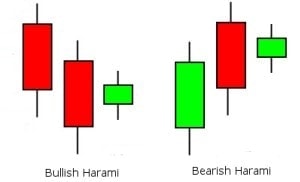
Whether you’re talking about a Bearish or a Bullish Harami, the pattern will contain two candles and the second will be smaller than the first. Harami actually means pregnant woman in Japanese, which makes sense when you consider this signal’s shape: the second candle is enclosed within the body of the first. You can think of the second candle as the first candle’s baby belly!
If you think you’ve detected a Harami, check for the following criteria. And don’t worry – it’s very easy to spot!
- There is an obvious trend occurring, whether it’s an uptrend or a downtrend.
- The first candle must continue with the trend’s direction. It will be the same color as the current trend, and it will have a long body.
- The second candle must be contained within the first candle’s body (so it opens and closes within the limits of the first candle). It can be either color, and it will have a smaller body. Only the body needs to be contained within the first candle; the wicks are irrelevant.
Meaning
A Bearish Harami’s first candle indicates that the current uptrend is continuing and the bulls are pushing the price higher. However, the bears then step in and the price opens lower than the previous day’s close. The bulls grab their profits and exit before the price closes lower for the day.
The opposite is true for the Bullish Harami, whose first candle indicates that the current downtrend is continuing and the bears are pushing the price lower. However, the bulls then step in and the price opens higher than the previous day’s close. The bulls now preside and the stock goes up in price.
To learn more about a Harami, look for the following characteristics:
- The longer the candles, the more forceful the reversal should be.
- In a Bullish Harami, the higher the second candle closes up on the black candle, the more likely it is that a reversal will occur.
- In a Bearish Harami, the lower the second candle closes down on the white candle, the more likely it is that a reversal will occur.
Examples
Considering the simplicity of the Harami candlestick pattern, it shouldn’t surprise you that it often appears on candlestick charts. To get a better idea how it might look in the real world, check out the four examples below. You can spot the Harami patterns, determine whether they are bearish or bullish, and explore how well they predict the candles that follow.

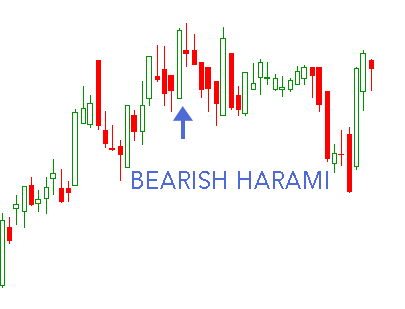
EXAMPLE 1:
This first example starts small and then dashes upward. After a large gap up, we see a long bullish candle with a long upper wick. Although the price stretched up during the course of the session, it closed further down. Then, a shorter bearish candle appears, enclosed within the body of the previous candle, forming a Bearish Harami pattern. As expected, the price dips after that; the upward momentum couldn’t last. The signal successfully predicted the downtrend.
EXAMPLE 2:
Despite a few setbacks, the bulls have pushed the price steadily upward in this second example. Just before the Harami appears, the bears attempt a downtrend once more. The bulls briefly prevail, forming the long green candle that begins the Harami pattern. A tiny doji with long wicks follows, finishing the Harami and forecasting a reversal that proves reliable.
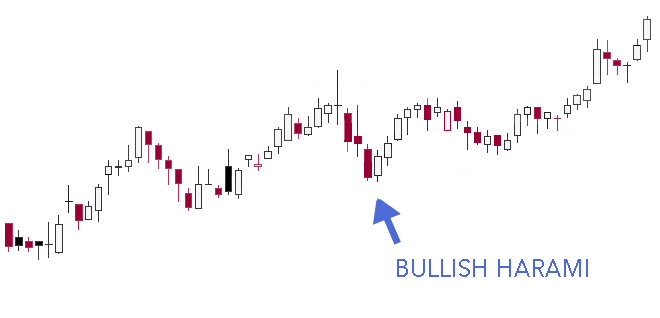
EXAMPLE 3:
In our third example, a brief downtrend ends with a Bullish Harami pattern. The two candles that comprise the signal are similar in size, but the first candle manages to engulf the second. Where the first candle shares the preceding candles’ bearish sentiment, the second candle flips and begins the chart’s newest uptrend. As expected, the uptrend continues after that.
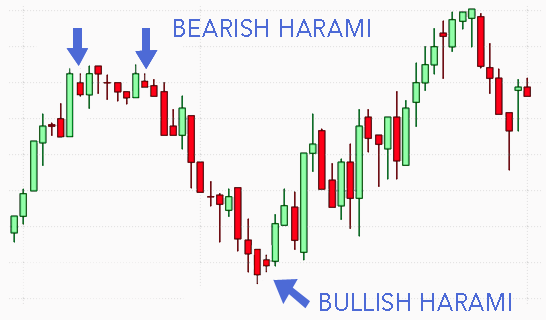
EXAMPLE 4:
For our last example, let’s fire on all cylinders. This chart contains three examples of the Harami candlestick pattern: two bearish and one bullish. We begin with a steep upward climb, which includes a lengthy green candlestick – the introductory candle of a Harami pattern. A small red candle follows, but it doesn’t reach very far down the green candle and fails to launch a reversal. This is a great example of why you should always wait for confirmation before reacting to a Harami.
A sideways movement follows with a mix of red and green candles. In the midst of this, you can spot another longer green candle that encapsulates the subsequent red candle, forming the second Harami on the chart. This time the signal proves successful, predicting the long downtrend that follows.
At the bottom of the market’s plunge, our final Harami appears. This is a Bullish Harami, so it begins with a red candle that continues the preceding downtrend. A tiny red candle follows (remember that the second candle’s color doesn’t matter), heralding the uptrend that materializes soon after. Despite a few setbacks (illustrated by the red candles), the upward price movement prevails for nearly half the chart.
_____
Even if your gut tells you to follow the forecast of a Harami, we always recommend waiting for confirmation before acting. To confirm a Harami candlestick pattern, check that the price trades above the pattern for a bottom reversal, and that it trades below the pattern for a top reversal. Good luck!
If you’re interested in mastering some simple but effective swing trading strategies, check out Hit & Run Candlesticks. Our methods are simple, yet powerful. We look for stocks positioned to make an unusually large percentage move, using high percentage profit patterns as well as powerful Japanese Candlesticks. Our services include coaching with experienced swing traders, training clinics, and daily trading ideas. To sign up for a membership, please click here.


Comments are closed.