Live Trading Alerts
Information about a chart, Price action, trend, patterns, and

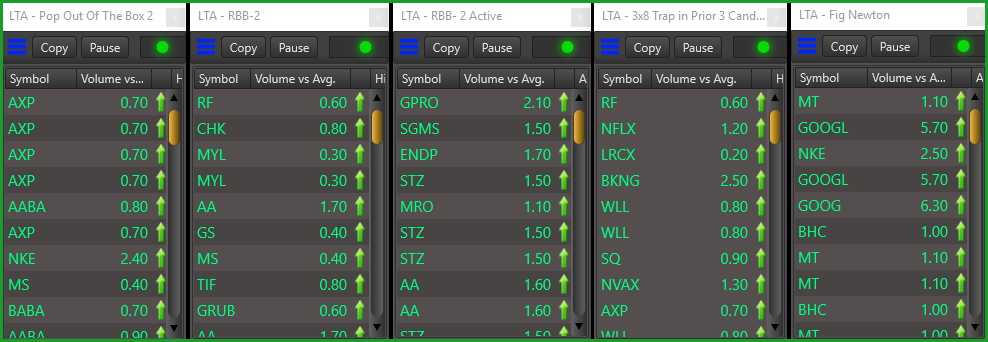
Information about a chart, Price action, trend, patterns, and
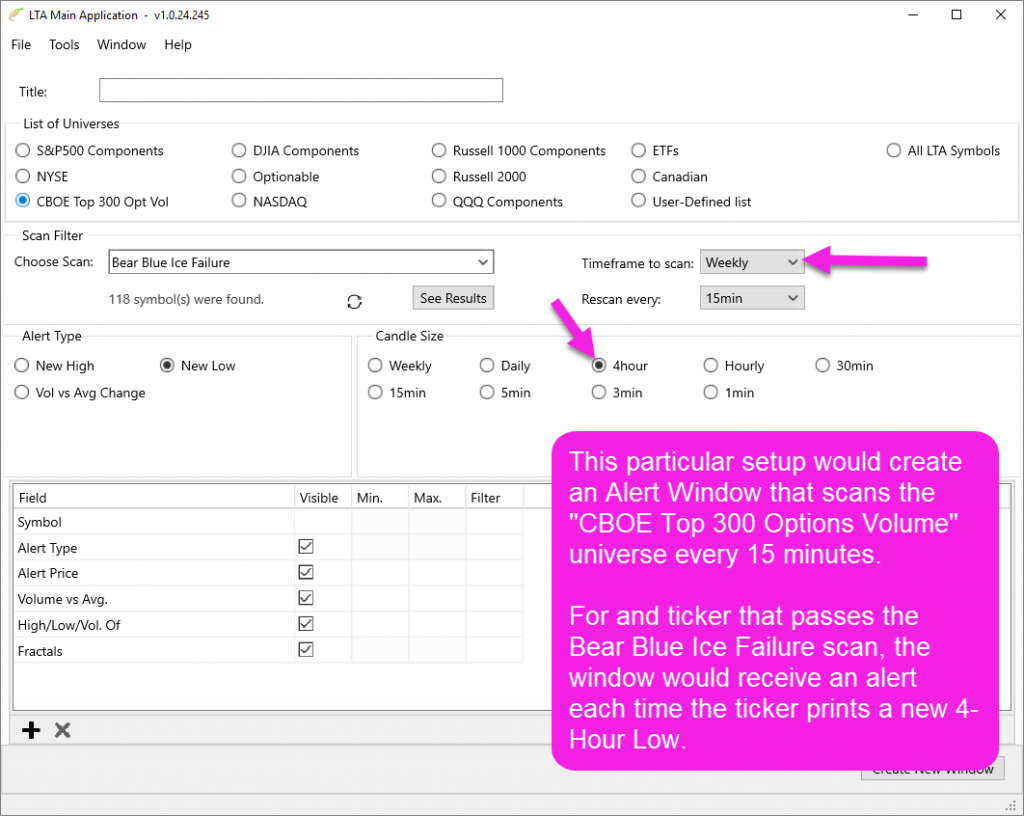
The next release of LTA will include two new timeframes. These can be used both as a “Timeframe to Scan” and as your “Alert Timeframe.”
As always, these two timeframes can be mixed and matched as the user sees fit. For example, you can scan for a particular Bullish chart pattern on a Daily level and then get alerts when stocks that pass this daily scan then print new Hourly highs. Or in this case, you might choose to scan for a Bearish Weekly chart pattern and then get alerts when the tickers that pass this bearish scan print a new Low on their 4-Hour chart.