Rick’s Featured Trade Ideas
Today’s featured trade idea and my personal trade plan
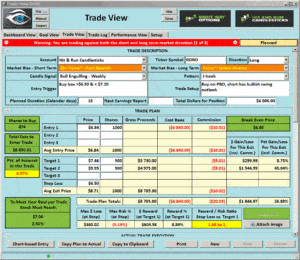
GORO Long | Broke over resistance, Weekly J-Hook Pattern
Double click Trade View to enlarge
 Good Morning, Profit Traders,
Want to hang out with some of the best traders in the world?
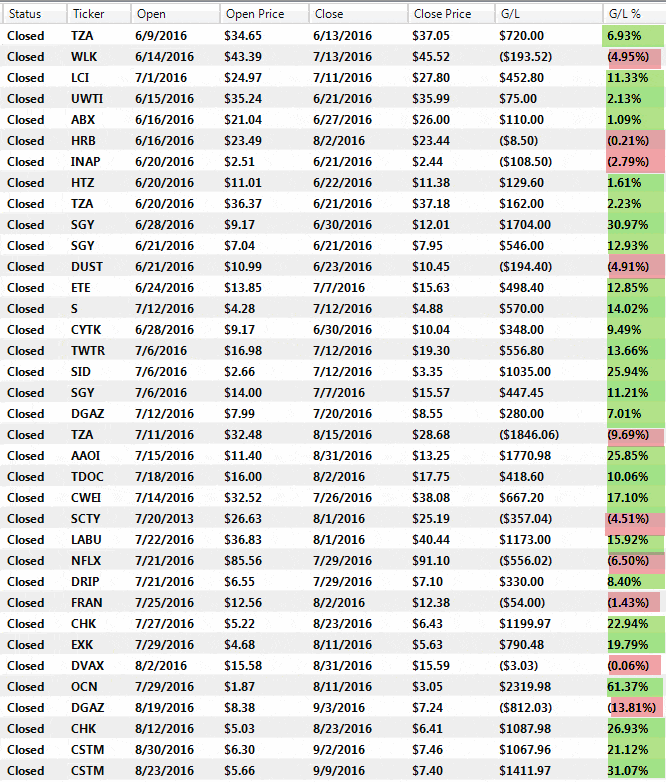
Want to learn how the best, the highest probable trades? Did you know you don’t have to be in the trading room to learn and bank profits? Below are a few trades that have been on our news board.
CONN +23.75%
PTCT +33.86%
CMRD +53.49%
BLOX +22.79%
OVAS +32%
We offer affordable membership and private coaching. Take the next step Click Here
No rate hike! If history repeats itself and it should, the bulls should be feeling pretty good. Price has closed over the important $215.55 area and will try to take on the $216.80 area, which is another resistance area that the bulls needs to win. The 3-day chart is forming a Bullish Morning Star signal and with follow-through, over $216.80 could set the bulls free to print new highs.
Rick & Hit and Run Candlestick Team
Members Daily Trade Ideas. Be aware of sudden market changes!
This list is reserved for subscribed members
These are the stocks I put on my watch list to trade. I focus on these stocks for Swing Trades and the potential 10% – 40% gains. You must follow your trading rules for entry stops, profits or losses. Remember to check for earnings!
Keep your eye on the inverse ETF’s They trade well!
Continue Reading
Rick’s Featured Trade Ideas
No trade ideas today
Double click image to enlarge
 Good Morning, Profit Traders,
We offer affordable membership and private coaching. Take the next step Click Here
What can you say? If the market likes what Janet says, then it will go up; if the market does not like it, then down. It really is as simple as that. We sold off most of our winners yesterday to protect profits ($$$$$$). Today and through the knee-jerk reaction following, we will manage the trades we have kept. We will start to buy more positions if the chart patterns are there in both the market and stocks.
Trade with rules
Rick | Hit and Run Candlestick Team
Members Daily Trade Ideas. Be aware of sudden market changes!
This list is reserved for subscribed members
No trade ideas today
These are the stocks I put on my watch list to trade. I focus on these stocks for Swing Trades and the potential 10% – 40% gains. You must follow your trading rules for entry stops, profits or losses. Remember to check for earnings!
Keep your eye on the inverse ETF’s They trade well!
Continue Reading
Rick’s Featured Trade Ideas
Today’s featured trade idea and my personal trade plan
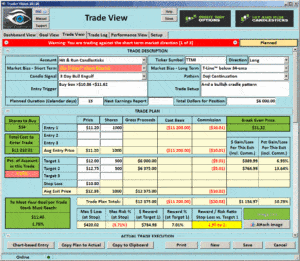
TTMI Long | Trending, Bullish Cradle pattern, Bullish Doji Continuation pattern
Double click the trade plan to enlarge
 Good Morning, Profit Traders,
Another Steller day for the HRC member trade ideas
PTCT +33.86%
CMRD +53.49%
BLOX +22.79%
OVAS +32%
We offer affordable membership and private coaching. Click Here
$212.30 remains support and $215.55 remains resistance on the SPY chart. Not much has changed in the past 6 trading days. Resistance is resistance and support is support. Both the buyers and sellers seem content on waiting for the FOMC and BOJ to bless us with their words of wisdom (Ha). Either way, price remains trapped between support and resistance, and the T-Line™ seems to be keeping the bulls from escaping.
Computer distribution was the big winner yesterday gapping and closing up 6.7% while Semiconductor memory was received poorly, down 2.66%
All the best to your trading success!
Rick | Hit and Run Candlestick Team
Trading knowledge ignites successful stock trading.
—————————————————————————————–
Members Daily Trade Ideas. Be aware of sudden market changes!
This list is reserved for subscribed members
These are the stocks I put on my watch list to trade. I focus on these stocks for Swing Trades and the potential 10% – 40% gains. You must follow your trading rules for entry stops, profits or losses. Remember to check for earnings!
Keep your eye on the inverse ETF’s They trade well!
Continue Reading
Rick’s Featured Trade Ideas
Today’s featured trade idea and my personal trade plan
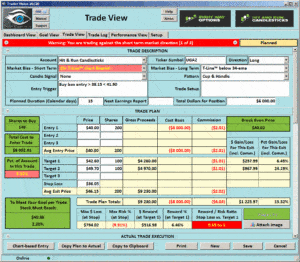
UGAZ Long | Support, Breaking a downtrend line, Bullish T-Line™, C & H
Double click the trade plan to enlarge
 Good Morning, Profit Traders,
$212.30 remains support and $215.55 remains resistance on the SPY chart. The T-Line™ should be considered now that it has caught up to price. This week the big bad FOMC meets and will let us know of a rate hike or not, which I suspect will move the market.
Last week we were able to find great trades in both long charts as well as inverse ETFs in lieu of short trades. I expect nothing different this week.
All the best to your trading success!
Rick | Hit and Run Candlestick Team
Trading knowledge ignites successful stock trading.
—————————————————————————————–
Members Daily Trade Ideas. Be aware of sudden market changes!
This list is reserved for subscribed members
These are the stocks I put on my watch list to trade. I focus on these stocks for Swing Trades and the potential 10% – 40% gains. You must follow your trading rules for entry stops, profits or losses. Remember to check for earnings!
Keep your eye on the inverse ETF’s They trade well!
Continue Reading
Rick’s Featured Trade Ideas
Today’s featured trade idea and my personal trade plan
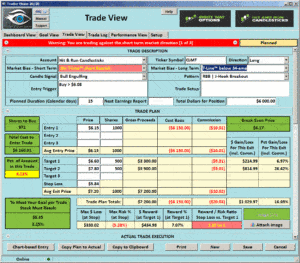
CLMT Long | RBB, Bull Engulf, J-Hook Continuation Pattern
Double click the trade plan to enlarge
 Good Morning, Profit Traders,
$215.55 and now the T-Line™ have joined the resistance team. As far as price action and a bullish candle pattern go, yesterday was a strong day for the bulls, just not strong enough to close over what they needed which was to close over the $215.55 resistance line. My stand this week has been under $215.55, sellers have control; over that, the buyers have taken a baby step toward bullishness.
Quad Witching Today, Here’s something on triple witching? It is a phenomenon that occurs on the third Friday of four months: March, June, September, and December. The day is known as…triple witching
Recently I have been asked about the Bullish Kicker Candle Pattern…Read More
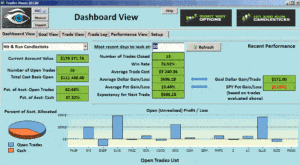
Above is a Snapshot of my current positions and the past 30 days of business
All the best to your trading success!
Rick | Hit and Run Candlestick Team
Trading knowledge ignites successful stock trading.
Members Daily Trade Ideas. Be aware of sudden market changes!
This list is reserved for subscribed members
These are the stocks I put on my watch list to trade. I focus on these stocks for Swing Trades and the potential 10% – 40% gains. You must follow your trading rules for entry stops, profits or losses. Remember to check for earnings!
Keep your eye on the inverse ETF’s They trade well!
Continue Reading
Rick’s Featured Trade Ideas
Folks there are some days it’s best to just go fishing.
I feel that trading today or maybe the next few days would a tug a war between equal powers and nothing really happens, the fruit will be ripe for the picking very soon.
 Good Morning, Profit Traders,
For now, the SPY is happy with $212.31 acting as support, but we have yet to see bullish follow-through to suggest the bulls are taking the game back. The T-Line™ is below the 34-ema, and price remains under the T-Line™. This is a smack in the face that the sellers still overwhelm the buyers. $215.55 is still the first upper resistance line the bulls need to attack and win. A close below $212.55, the battleground becomes the $210.25 area. Price is below all of our intraday deuce trios except for the 4-hour chart which is right in the trio middle.
Something to Think About – A cluster of narrow range candles often leads to big profits.
All the best to your trading success!
Rick | Hit and Run Candlestick Team
Trading knowledge ignites successful stock trading.
—————————————————————————————–
Members Daily Trade Ideas. Be aware of sudden market changes!
This list is reserved for subscribed members
These are the stocks I put on my watch list to trade. I focus on these stocks for Swing Trades and the potential 10% – 40% gains. You must follow your trading rules for entry stops, profits or losses. Remember to check for earnings!
Keep your eye on the inverse ETF’s They trade well!
Continue Reading
Rick’s Featured Trade Ideas
Today’s featured trade idea and my personal trade plan
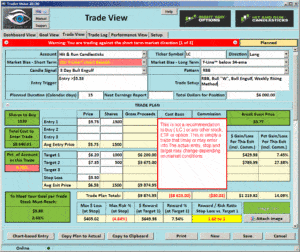
LC Long | RBB, Bull “W”, Bull Engulf, Weekly Rising Method
Double click the trade plan to enlarge
 Good Morning, Profit Traders,
It looks as if the futures are suggesting an open above $212.31 (current support line) and below $215.55 (current resistance line). From the recent top and the June 27 low, the SPY is between the 23.6% and the 38.2% fib lines. From the February low, we are not even to the 23.6% Fib line. The T-Line™ has crossed below the 34-ema (bearish) and the visible candle patterns are all bearish.
How does all this fit in your trading plan?
Something to Think About – Support and Resistance are useless unless price approves it.

All the best to your trading success!
Rick | Hit and Run Candlestick Team
Trading knowledge ignites successful stock trading.
—————————————————————————————–
Members Daily Trade Ideas. Be aware of sudden market changes!
This list is reserved for subscribed members
These are the stocks I put on my watch list to trade. I focus on these stocks for Swing Trades and the potential 10% – 40% gains. You must follow your trading rules for entry stops, profits or losses. Remember to check for earnings!
Keep your eye on the inverse ETF’s They trade well!
Continue Reading
Rick’s Featured Trade Ideas
Today’s featured trade idea and my personal trade plan
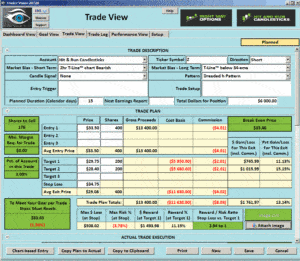
Z Short| Doji continuation pattern
Double click the trade plan to enlarge
 Good Morning, Profit Traders,
BULLISH PIERCING CANDLE…Yeah, let’s get BULLISH! ……Hold on, Hold on, Hold on.
Yes, yesterday painted a bullish piercing candle on top of Friday’s gap down, Island reversal, monster decisive bearish candle. Candlesticks require confirmation! Also, the bearishness has come from planning and building — two Evening Stars, a double top, and the Island Reversal. One candlestick candle is not a game changer. Step back and take a look at the chart, (not the hard right edge candle). What does it look like to you?
Yesterday’s members’ closing market comments.
The SPY would have to be over $215.55 and stay over $215.55 to have a bullish chance. Below $215.55 keeps the bear in a powerful position.
All the best to your trading success!
Rick | Hit and Run Candlestick Team
Trading knowledge ignites successful stock trading.
—————————————————————————————–
Members Daily Trade Ideas. Be aware of sudden market changes!
This list is reserved for subscribed members
Reserved for Members
These are the stocks I put on my watch list to trade. I focus on these stocks for Swing Trades and the potential 10% – 40% gains. You must follow your trading rules for entry stops, profits or losses. Remember to check for earnings!
Keep your eye on the inverse ETF’s They trade well!
Continue Reading
Rick’s Featured Trade Ideas
Today’s featured trade idea and my personal trade plan
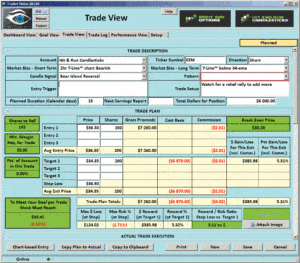
EEM | 3-day Evening Star | 3-day Red Ice Fail
Double click the trade plan to enlarge
 Good Morning, Profit Traders,
Price closing Friday below the 34-ema and the T-Line™ will likely do the same today, putting the sellers in complete control. Price has broken through all of our possible support lines. Now the$210.25 support line is ready to be tested and likely broken over the next several days. One of our deuce lines sits at $208.45 and the big deuce sits at $205.65.
The stocks of the members’ trade idea list was TZA, SOXS and UVXY. If bought, you are rolling in money. Isn’t it fun to trade when you’re making money?
Watch for relief rallies…..
All the best to your trading success!
Rick | Hit and Run Candlestick Team
Trading knowledge ignites successful stock trading.
—————————————————————————————–
Members Daily Trade Ideas. Be aware of sudden market changes!
This list is reserved for subscribed members
Reserved for Members Only
These are the stocks I put on my watch list to trade. I focus on these stocks for Swing Trades and the potential 10% – 40% gains. You must follow your trading rules for entry stops, profits or losses. Remember to check for earnings!
Keep your eye on the inverse ETF’s They trade well!
Continue Reading


