Doji
The Doji is one of the most informative signals in Candlestick trading and is comprised of one candle. It forms when the open and close occur at the same level (or very close) in a specific time-frame.
In order for a doji signal to be valid it must meet two conditions. First, the open and the close of the stock must be almost at the same price level (as stated above). Second, there must be an upper shadow or a lower shadow, or both.
When a doji candlestick is formed, a cross formation appears (as seen above) with the horizontal line representing the open and close occurring at the same level. The vertical line on the doji candlestick chart represents the total trading range during that time-frame. This clearly indicates that the bulls and the bears are at an equilibrium signifying a state of indecision. When this occurs the trader should keep an eye out for a trend reversal. From bullish to bearish or bearish to bullish.
There are three special types of Doji’s explained below
Examples Bullish
ADM- Doji/Gap up November 15, 2012
Examples Bearish
ADM – Doji/Gap down October 18, 2012

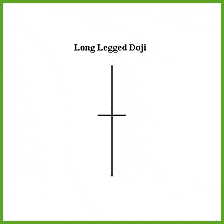
Long-legged Doji – This doji line has a long upper and lower shadow with the price in the middle of the range. It is a very important reversal signal and it signifies a great amount of indecision in the market. It is formed when prices trade well over and below the day’s opening price, but then close almost at the same level as the opening price.
Examples Dragonfly Doji

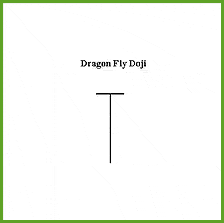
Dragonfly Doji – This doji line has a long lower shadow and no upper shadow and it indicates a bearish to bullish trend reversal when found at the bottom of a trend. This type of doji opens at the high of a session, has a significant inter period decline, then it climbs back up closing at the same level as the open, show that the buyers have a slight upper hand by closing the candle back near it’s open.
Examples Gravestone Doji
Dragonfly Doji – This doji line has a long lower shadow and no upper shadow and it indicates a bearish to bullish trend reversal when found at the bottom of a trend. This type of doji opens at the high of a session, has a significant inter period decline, then it climbs back up closing at the same level as the open, show that the buyers have a slight upper hand by closing the candle back near it’s open.

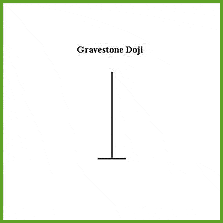
Gravestone Doji – This doji line has a long upper shadow and no lower shadow and indicates a bullish trend reversal. It is derived by the formation of the signal looking like a grave stone and is formed when the open and close occur at the low of the day. Its specialty is for calling market tops and it could indicate imminent disaster for a stock.


