Last Updated: September 29, 2016
The word piercing has several varied definitions, but most of them revolve around the same idea: “go into or through something,” “force or cut a way through,” “seeming to cut through one,” “bore a hole or tunnel through,” etc. The Bullish Piercing candlestick pattern is likely named piercing because of the way the white candle’s close cuts through the midpoint of the previous day’s black candle. This two-candle, bullish signal is easy to spot and confirm, so take advantage of it! Scroll down to learn how to identify, interpret, and react to the Bullish Piercing pattern.

Bullish Piercing Pattern
Formation
Trying to identify the Bullish Piercing pattern? Look for this essential criteria:
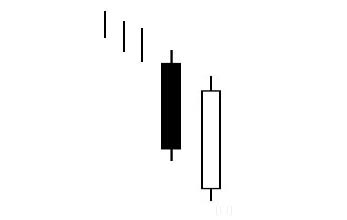
First, there must be a clear and definable downtrend in progress for the pattern to qualify as a Bullish Piercing pattern. Second, the first candlestick (which appears at the end of the downtrend) must be a black (or red), bearish candlestick. Third, the second candlestick must be white (or green) and bullish. Fourth and finally, the second candlestick (the white one) must open below the black candlestick and close above the black candlestick’s midpoint. So if you mark a dotted line through the vertical center of the black candlestick, does the white candle close above it? If so, it can qualify as a Bullish Piercing pattern.
Meaning
So what does this pattern mean? Well, clearly a downtrend has been in effect. The tone is bearish, fear is spreading, and the price is moving downward. Although the bears continue pushing the price down at the start of the day, the bulls jump in and grab the reins. The price turns around dramatically, finishing near the high of the day. It has almost (but not quite) nullified the previous day’s price decline.
To learn more about the specific Bullish Piercing pattern that you’ve spotted, keep an eye out for the following characteristics:
- The longer the two candles are, the more forceful the reversal.
- The greater the gap down from the black candle to the white candle, the more powerful the reversal will be.
- The higher the white candle closes on the black candle, the more pronounced the reversal.
- The larger the body of the black candle, the more significant the downtrend (and thus, the more pivotal the reversal).
Examples
You know what the Bullish Piercing pattern looks like. You understand what to expect from the bulls and the bears after you spot it. However, just knowing the facts doesn’t guarantee that you can apply the knowledge when the time comes. Before you head out into the real world, review the examples below, using them like homework. Test your mastery of the Bullish Piercing pattern by interpreting the data yourself before reading the explanation. If it weren’t for the blue arrows and labels, do you think you could spot the Bullish Piercing pattern in the following four examples?
EXAMPLE 1:
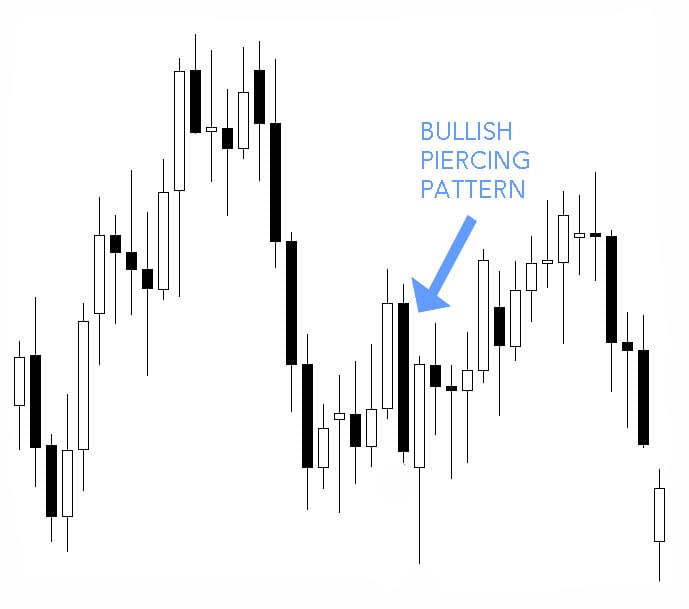
Let’s start with the downtrend that precedes the Bullish Piercing pattern. After a few unpredictable doji (which convey the uncertainty of investors), the price swiftly falls with two giant, bearish candles. Following this clear downtrend, our Bullish Piercing pattern appears. The price opens below the second long, black candle, but then it zooms upward, forming a long white candle. Since this white candle closes above the black candle’s midline, it forms a Bullish Piercing pattern. The length of the two candles increases the likelihood of a strong reversal. And as expected, the signal successfully foreshadows a persistent bullish reversal.

EXAMPLE 2:
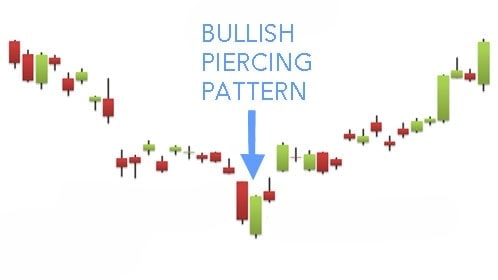
This example is a bit tricky, and some might say it doesn’t show a Bullish Piercing pattern at all. Why? The pattern is not immediately preceded by a downtrend. Following this chart’s downtrend, there is a weak uptrend, and that is followed by the Bullish Piercing pattern. A long black candle appears, and a white candle comes behind. The white candle opens below the black candle’s bottom and closes above the black candle’s midpoint, forming the Bullish Piercing pattern. A strong uptrend follows.
EXAMPLE 3:
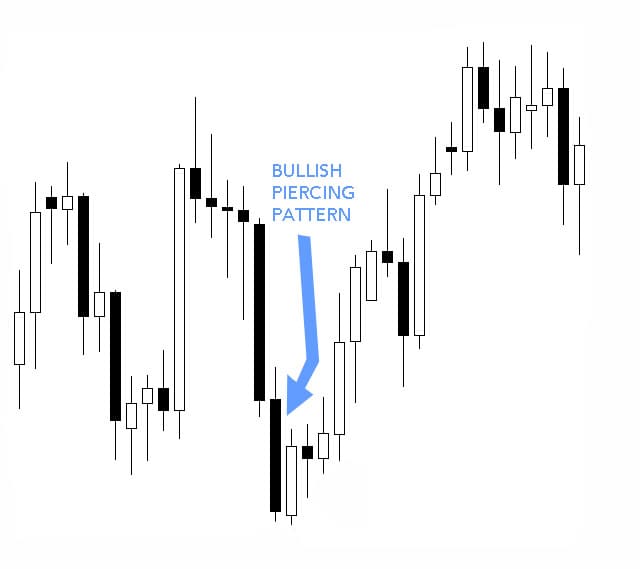
Unlike the second example, this third example is more straightforward. The downtrend that precedes the pattern is clear and defined, formed of eight bearish candles. After the last red candle, the price gaps down to open; some might initially assume that this day would further the downtrend. However, the bulls seize control of the market to push the price above the prior day’s midpoint. Although a single red candle follows (confusing investors waiting for confirmation), an uptrend comes after that.

EXAMPLE 4:
Our last example is spattered with doji, communicating the market’s extreme uncertainty. However, the Bullish Piercing pattern itself is composed of two longer candles. Following a doji-filled downtrend, a bearish candle appears. The next day, the price gaps down to open, and during the course of the day, it rises above the previous candle’s midpoint. Although more doji follow (including many bearish doji), they form into a clear uptrend. As expected, the price has reversed.
– – – – –
If you spot a Bullish Piercing signal and you want to take advantage of it, buy the stock so that you can ride it as the price escalates, giving you a profit. To confirm the pattern, look for more buying on the following day. The price should trade above the body of the white candle. A similar pattern that is far more bullish is the Bullish Engulfing Pattern (in which the second candle closes above the first candle’s body) – don’t mistake this pattern for that.
Good luck!
If you’re interested in mastering some simple but effective swing trading strategies, check out Hit & Run Candlesticks. Our methods are simple, yet powerful. We look for stocks positioned to make an unusually large percentage move, using high percentage profit patterns as well as powerful Japanese Candlesticks. Our services include coaching with experienced swing traders, training clinics, and daily trading ideas. To sign up for a membership, please click here.


Comments are closed.