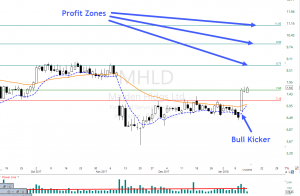
Bull Kicker Rounded Bottom Breakout Strategy
 MHLD printed a Bullish Kicker last Wednesday followed by two days of rest. The MHLD chart has been trending down and may now be ready for a relief rally to the 200-SMA then to test the $11.00 area. We have swing profit zones near the November high then above the 200-SMA. Our basic strategy will be the Rounded Bottom Breakout selling into strength.
Today At 9:10 AM ET. We will demonstrate live how MHLD could be traded using our Simple Proven Swing Trade Tools
►Simple Proven Swing Trade Tools
Candlesticks • Price Action T-Line • T-Line Bands • Support • Resistance • Trendlines • Chart Patterns • Buy Box • Volatility Stops • Profit Zones • Entry Zones • Protective Stops • RBB Rounded Bottom Breakout Strategy • Pop Out of The Box Strategy • Pinball Strategy • Continuation Patterns • Trade Planning
[button_2 color=”blue” align=”center” href=”https://hitandruncandlesticks.com/hrc-rwo-30-day-offer/” new_window=”Y”]Learn the T-Line Bands Price Action Strategy 30-Days $14.00[/button_2]► Learn the Power (NUGT)
On January 10, we shared, in detail, the technical chart properties of NUGT in our members Trading Room and why we thought this chart was ready for a test of the resent high with a breakout. Friday the profits would have been about 11.95% or $370.00 with 100 shares. Using our Simple, Proven Swing Trade Tools and techniques to achieve swing trade profits. (See Above)
► Eyes On The Market
The Bulls seems to be feeling pretty good about there selves today with the futures up. All I can say is don’t fight the trend, waiting for minor profit taking to find a PBO entry is a winning strategy.
The T-Lines have stayed bullish climbing higher with price only returning for more money to pour in.
Now and then the market feels the need to wake us up. Tuesdays Doji close in the SPY and Wednesdays gap did just that, even tho we can see the trend is bullish. If you mix the price action of the last three days you pretty much have normal action in a bullish chart. A good rule of thumb is that if the price can close over the T-Line High and if the T-Line High is higher than it was 10-20 days ago the bulls are winning the game. Read the chart and what you know to determine how and what you should trade.
The VXX short-term futures just can/t seem to close above the Lower T-Line and show follow through, but when it does the bear will get bigger.
Rick’s Swing Trade ideas – MEMBERS remember to log into the members’ blog for the trade ideas – Member Login
30-Day Trial • Monthly • Quarterly • Semi-Annual • Annual
Candlesticks • Price Action T-Line • T-Line Bands • Support • Resistance • Trendlines • Chart Patterns • Buy Box • Volatility Stops • Profit Zones • Entry Zones • Protective Stops • RBB Rounded Bottom Breakout Strategy • Pop Out of The Box Strategy • Pinball Strategy • Continuation Patterns
[button_2 color=”blue” align=”center” href=”https://hitandruncandlesticks.com/private-personal-coaching-right-from-the-pros/” new_window=”Y”]Learn From A Coach • Take That Next Step[/button_2]
Investing and Trading involves significant financial risk and is not suitable for everyone. No communication from Hit and Run Candlesticks Inc. is financial or trading advice. All information is intended for Educational Purposes Only. Terms of Service.
Rick Saddler is not a licensed financial adviser nor does he offer trade recommendations or advice to anyone except for the trading desk of Hit and Run Candlesticks Inc.
*************************************************************************************


Comments are closed.