Rick’s Featured Trade Ideas
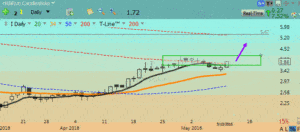
I/Long |Breakout | RBB | Morning Star Signal |PBO J-Hook
I| Plan your trade & trade your plan | May 11, 2016
Possible entry plan idea: Buy box $3.64- $4.18
Possible stop plan idea: Protective stop below $3.64
Swing trade playground: $3.64 – $5.47 = 49%
Playground risk reward: 6:1 + depending on | entry | exit | stop
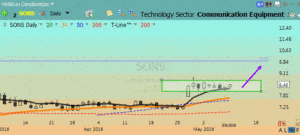
 Yesterday’s featured trade idea SONS was bought at $8.52 while in the buy box. The chart remains bullish with a doji candlestick yesterday closing over the T-Line.
Last night we had a great members’ e-learning class talking about the rising 20-day simple moving average and utilizing On Balance Volume (OBV), using both of them to narrow down your watch list for your trade ideas.
SPY: T-Line ™ chart suggest the buyers are in control
7:00 am: Another terrific swing trading day yesterday with the SPY closing at $208.45 or 1.24%. The Bullish Engulf, Doji, followed by a positive, bullish close is what we call a Doji continuation pattern. This pattern suggests the Bulls are in control, and it looks like they may be headed for the April 20 high. Of course, this is contingent on the bulls controlling the $207.00 line. As seasoned traders, we know that price may consolidate for a day or two before moving up, and as seasoned traders, we know to have patience and allow the chart to work. We also know as seasoned traders to be respectful of price action if it runs into trouble and to pay attention to support and resistance.
The SPY and the DIA closed over the 20-day simple moving average yesterday, and today, tomorrow or Friday, all eyes will be on IWM, IYT and the QQQs to see if they can follow and capture the 20-day simple moving average.
Trading knowledge ignites successful stock trading.
All the best to your trading success!
Rick
Continue Reading
Rick’s Featured Trade Ideas
SONS/Long |Breakout | PBO to support | Flag |Rising T-Line™
SONS| Plan your trade & trade your plan | May 10, 2016
Possible entry plan idea: Buy box $8.05- $8.70
Possible stop plan idea: Protective stop below $8.05
Swing trade playground: $8.05 – $13.10 = 62%
Playground risk reward: 5:1 + depending on | entry | exit | stop
 SPY: T-Line ™ chart sellers in control, and candlesticks suggest bulls are trying.
7:00 am: Friday’s Bullish Engulf came within pennies of tagging one of our horizontal support lines followed by Monday’s bullish Doji (closing high on Friday’s Bullish Engulf) is suggesting that price may try to win over the $207.00 area once again. A close over $207.00, as we’ve stated several times in the past couple weeks, is what the Bulls need to take on the April 20 highs which could help push price into the all-time highs. The 20-day simple moving average is resting at $207.52, and if the Bulls can close over the 20-day simple moving average, this will show strong bullish intention. Follow-through is very important here because of that left shoulder hanging out in early April.
My T-Line™ chart still suggests the sellers are in control, but the Candlestick signals are suggesting a price turn may be underway. If price falls short of controlling the $207.00 area, the T-Line™ chart will win out and the sellers may win the overall game by cracking the $203.73 support line that the Bulls have recently found support on. Once again, I want to strongly suggest that we pay attention to the $207.00 area and what the paint on the canvas is trying to tell us.
Trading knowledge ignites successful stock trading.
All the best to your trading success!
Rick
Continue Reading
Offhand, if you had to guess, based purely on the name, I bet that you would think the Separating Lines pattern heralds a reversal. After all, a separation hints at a change in sentiment, which would lead one to believe that the tables have turned. Have the bears passed the reins to the bulls or vice versa? In fact, no. The Bullish Separating Lines pattern is a continuation signal in which the bears briefly control the market before the bulls sweep in, continuing the prior uptrend.
Continue Reading
Rick’s Featured Trade Ideas
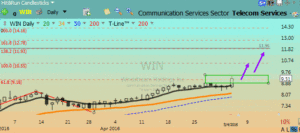
WIN/Long (Telecom) | J-Hook breakout | Doji back to support | Rising T-Line™
WB| Plan your trade & trade your plan | May 3, 2016
Possible entry plan idea: Buy box $8.92- $9.55
Possible stop plan idea: Protective stop below $8.64
Swing trade playground: $8.92 – $11.95 = 33%
Playground risk reward: 15:1 + depending on | entry | exit | stop
 SPY: T-Line ™ chart is cracking
7:00 am: As we thought yesterday, the trend continued to slide with the SPY closing down .56% with a Doji close and now getting slightly oversold. Yesterday’s oversold doji close is very near the 50-day simple moving average and recent price action support, not to mention the 23.6% retracement line. So the likelihood of a short-term relief rally is highly probable. The $207 area remains a very important roadblock for the buyers to get through. Without $207, the sellers from the past couple of weeks remain in charge.
When a chart has been in the sellers house longer than it should have been and when it’s leaving behind a topping pattern, it requires more than just a one or two positive candle moves. We should be very careful not to get tricked into head fakes. One of the hardest things for us to learn as traders is patience — the patience to allow a pattern to form over a few days. The foundation formation is what creates a bullish run — that is the foundation for a bullish trade. As of the close yesterday, the T-Line chart continues to show that the sellers are in control.
Trading knowledge ignites successful stock trading.
All the best to your trading success!
Rick
Continue Reading
 Yesterday’s featured trade idea SONS was bought at $8.52 while in the buy box. The chart remains bullish with a doji candlestick yesterday closing over the T-Line.


