They’re two of a kind, a perfect pair, practically twins: the two white candlesticks in the Bearish Side by Side White Lines pattern are the same color and roughly the same size. But despite their aesthetic similarities, they’re actually trying to tell investors about a moment of discord. For two days in a row, the exact same thing has happened. No progress has been made. What’s going on? To better understand what the Bearish Side by Side White Lines pattern is trying to say, scroll down.
Continue Reading
Rick’s Featured Trade Ideas
Today’s featured trade idea and my personal trade plan
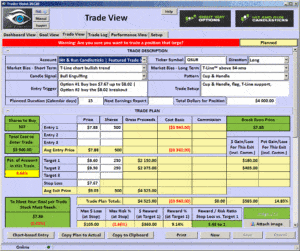
OSUR/LONG | C&H | Flag | Bullish Flag
 “The Alaskan Trading Cruise” – Only a $100 deposit June 6 and June 12, 2016
Plus bonuses from H&R and RWO.. Please be our guest for dinner July 8 for meet up and get to know each other.
SPY: T-Line™ Chart: Buyers Trend | Candle price action, weak | Toppy Overbought
Good Morning, Profit Traders,
I see the morning futures have dropped 12 points or down to $210.77 as a write this note. You may have noticed in yesterday’s note I offered a Traders Tip: “In my 27 years of studying Candlesticks, one of the Trader Tips that I would like to share is that a candlestick signal or candlestick pattern is not required to produce results immediately.” This is something I learned to recognize years ago, and it has also taught me patience because of the importance of allowing the pattern to be decisive. This is one of the key points I bring up in the trading room and during private coaching.
Unless the buyers participate, I would suspect a bit more downside. A few possible targets that I’m looking at are $210.25 then possibly $209.15 and $208.50.
This could be one of the most important times of trading to have a plan for each and every trade. The reality is most traders continue to focus and buy long trades while the market is showing weakness. By having a plan, you’re able to look at the numbers and truly evaluate whether the trade is right at this time.
All the best to your trading success!
Rick | Hit and Run Candlestick Team
Trading knowledge ignites successful stock trading.
Continue Reading
Rick’s Featured Trade Ideas
Today’s featured trade idea and my personal trade plan
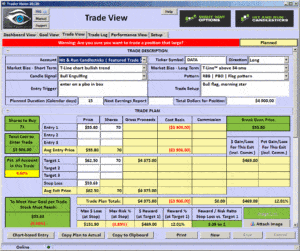
DATA/LONG |RBB| C&H| Morning star | Bullish Flag
 “The Alaskan Trading Cruise” – Only a $100 deposit June 6 and June 12, 2016
Plus bonuses from H&R and RWO.. Please be our guest for dinner July 8 for meet up and get to know each other.
SPY: T-Line™ Chart: Buyers Trend | Candle price action Toppy Overbought
Traders Tip – Candlestick signals are not required to produce the very next day
I really would’ve thought that Tuesday’s Shooting Star in the SPY would have caused a lower low on Wednesday, but not only did we not see a lower low, the SPY was able to find a higher high and close up .33%. If you trade the T-Line™ or are just simply familiar with it, then you have probably noticed in the past that price tends to not get too far from the T-Line™, and when it does, they both look to find each other. In my 27 years of studying Candlesticks, one of the Trader Tips that I would like to share is that a candlestick signal or candlestick pattern is not required to produce results immediately.
I see the morning futures are down, so we should probably take a look where we might find support. The first area of possible support I see is $210.90 followed by $210.12. The third possible support line if we fail the first two would be around $208.50. Overall, the SPY chart continues to be bullish and a minor profit taking pull back would be perfectly normal. Below the $208.50 support line would give me concern.
All the best to your trading success!
Rick | Hit and Run Candlestick Team
Trading knowledge ignites successful stock trading.
Continue Reading
Rick’s Featured Trade Ideas
Today’s featured trade idea and my personal trade plan
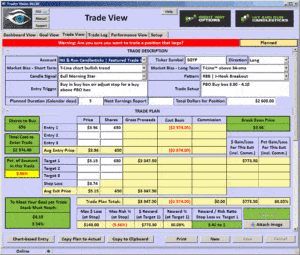
SGYP/LONG |RBB| Bullish “W” pattern | Morning star | Continuation pattern
“The Alaskan Trading Cruise” – Deposit special between June 6 and June 12, 2016
 SPY: High resistance $212.34 | High support near $208.85ish
T-Line™ Chart: Buyers Trend | Candle price action Weak, Toppy
Yesterday, June 6, was another great day in the market for Hit-And-Run Candlestick members. There were many of us who closed positions protecting profits. Yesterday the SPY closed with a Shooting Star candle. The Shooting Star candle is a clue that the market may be starting to tire and in need of a rest.
Taking a look at the sector indexes, I see basic materials, financial services and healthcare showing signs of stress, nothing serious as of yet.
Sector leaders yesterday were energy, communication services and real estate.
The volatility index VIX close yesterday with a belthold candle signal that closed engulfing, along with a double bottom. These are the little clues that we as traders need to pay attention to.
All the best to your trading success!
Rick | Hit and Run Candlestick Team
Trading knowledge ignites successful stock trading.
Continue Reading


