Rick’s Featured Trade Ideas
Today’s featured trade idea and my personal trade plan
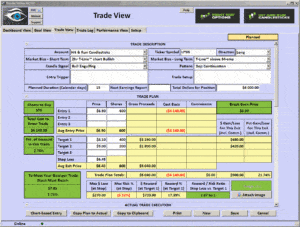
LPSN | Bullish trend break | Doji continuation pattern
SPY: T-Line™ T-Line is in a Bullish position with the 34-ema
 Good Morning, Profit Traders,
Last week the Bulls put together a beautiful bullish J-Hook Doji continuation pattern that closed Friday at $212.65 about a $1.15 from the all-time high. The T-Line™ is now back above the 34 EMA for those that follow the T-Line™/34 EMA trend.
Last week the Bulls put together a beautiful bullish J-Hook Doji continuation pattern that closed Friday at $212.65, about a $1.15 from the all-time high. The T-Line™ is now back above the 34 EMA for those that follow the T-Line™/34 EMA trend.
A successful Bull close over $213.80 would give us a bullish direction toward $214.90 followed by $217.65, with the typical chart dance up-PBO, up-PBO. Judging by the emails I received from members, huge profits were made last week and the majority feel this week will be the same. Success comes from planning, following your swing trade rules and selling into strength.
This week’s events – For more information Click Here
-Trader Vision 20/20 Workshop Monday July 11, 4pm EST
-HRC Public webinar Tuesday July 12, 8pm EST
-RWO Members Webinar Saturday July 16, 11am EST
All the best to your trading success!
Rick | Hit and Run Candlestick Team
Trading knowledge ignites successful stock trading.
Continue Reading
Rick’s Featured Trade Ideas
Today’s featured trade idea and my personal trade plan
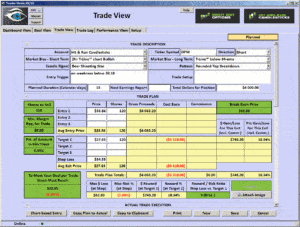
DPM/Short | RBB Top | H&S Top
SPY: T-Line™ T-Line is in a Bearish position with the 34-ema
 Good Morning, Profit Traders,
The market has been perfect for the short-term swing trader (5 to 7 days) but not so much for the trader that is greedy or pushes the envelope or the longer-term trader. Yesterday, the buyers were able to establish a low with a comeback Bullish Engulf. The chart pattern for the last seven days has been a Bull Flag. The question now, is there enough buyers to push us above the $209.88 resistance line? After all, trends are all about follow-through and continuation. In the trading world, we call this higher lows and higher highs if you’re looking for a bullish trend. $207.50 is a number that I believe the buyers should defend. If the sellers were to find themselves below $207.50, the bear may eat well.
All the best to your trading success!
Rick | Hit and Run Candlestick Team
Trading knowledge ignites successful stock trading.
Continue Reading
Rick’s Featured Trade Ideas
Today’s featured trade idea and my personal trade plan
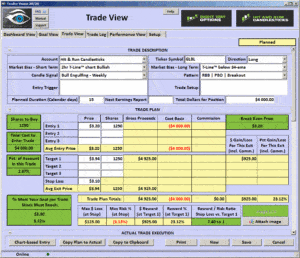
GLBL/Long |RBB| Doji Continuation | T-Line™ Run
 SPY: T-Line™ T-Line is in a Bearish position with the 34-ema
Good Morning, Profit Traders,
Yesterday, July 5, the SPY lost a buck and a half dropping to its 23.6% Fibonacci retracement of its recent relief rally. Yesterday morning, it looked as if price would find support around $207.85, as it did. Today, $206.40 is looking like the magic number, but of course there’s no guarantee this acts as support. On any given day we can find both long and short trades in a (big picture bullish or bearish market). If we take a step back and take an honest look at the SPY and the way it has been forming (head and shoulder pattern), as well as other subtle failures, it would be easy to make the conclusion that the sellers are outnumbering the buyers. With the weakness in the futures this morning, I’ll be watching to see if the SPY drifts to about $206.40. Just like yesterday, until we see a reversal buy signal or pattern, trade cautiously. Currently the market is not screaming bearish nor is it screaming bullish.
All the best to your trading success!
Rick | Hit and Run Candlestick Team
Trading knowledge ignites successful stock trading.
Continue Reading


