Rick’s Featured Trade Ideas
Today’s featured trade idea and my personal trade plan
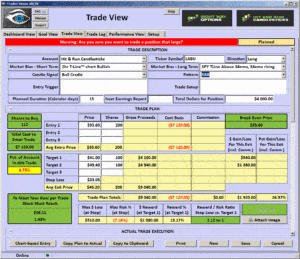
LABU | RBB |Bull Cradle
SPY: T-Line™ & 34ema bullish trend
 Good Morning, Profit Traders,
It would appear that we’re in for more of this slow grind with very minor dips and very minor pops. If the Bulls can manage to keep the SPY above $215.35, the Bulls bullish chart and run pattern will stay intact, but below $215.35, we could now see price below the T-Line™. Price below the T-Line™ could be setting us up for a bullish pullback as long as the pullback stays above $212.50.
I am starting to see a few intraday signs of laziness in the market. Let’s not forget, the bearish engulf on July 15 is still intact, and although the close yesterday was higher, it is higher without a great deal of confidence. If we do start to see weakness, there is an excellent chance we see a retest of the T-Line™.
All the best to your trading success!
Rick | Hit and Run Candlestick Team
Trading knowledge ignites successful stock trading.
Continue Reading
Rick’s Featured Trade Ideas
Today’s featured trade idea and my personal trade plan
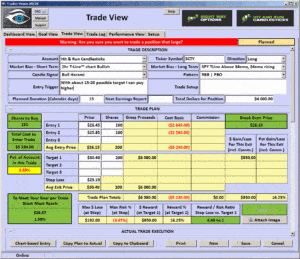
SCTY | RBB |Inside PBO | Bullish Harami | T-Line™ Trend Bullish
SPY: T-Line™ 34ema bullish trend | Market is very overbought
 Good Morning, Profit Traders,
SPY resistance — $217.01; support — $215.31.
Yesterday, the Bulls were not able to pass through the recent bearish engulf nor was the recent bearish engulf able to push the Bulls down. The battle will continue to unveil a winner, and when the winner is chosen then the battle will be to confirm success.
Overall, the Bulls continue to control this trend, and even a minor pullback would be a bullish pullback. Here at Hit-And-Run Candlesticks and Right Way Options, we continue to post bullish trades with positive results. Here are a few of yesterday’s results: APPS 12.28% | TDOC 9.10% | IMMR 8.13%
We continue to search out long and short trades for our subscribers, and we focus on strong chart patterns, price action (candlesticks signals), support and trade resistance, trade planning and common sense.
All the best to your trading success!
Rick | Hit and Run Candlestick Team
Trading knowledge ignites successful stock trading.
Continue Reading
Rick’s Featured Trade Ideas
Today’s featured trade idea and my personal trade plan
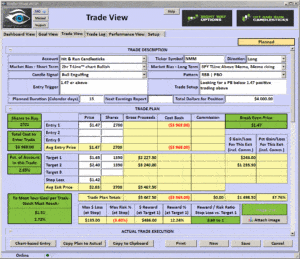
NMM | RBB |PBO Engulf | T-Line™ Trend Bullish
SPY: T-Line™ 34ema bullish trend | Market is very overbought
 Good Morning, Profit Traders,
The Bulls still control the SPY but there are signs that the bull is tired:
- The range has narrowed over the last couple weeks.
- The Doji bearish engulf is a warning sign not to take lightly.
- Yesterday’s close was outside of the narrowing trend.
We are predominantly long and still looking for long trade positions while the market may be entering a bullish pullback phase. The $212.50-ish (23.6% Fib retracement) pull back would be positive for the SPY chart. The $209-ish area would be something we will have to watch as it would be getting close to failing major support.
We are predominantly long and still looking for long trade positions while the market may be entering a bullish pullback phase.
The $212.50-ish (23.6% Fib retracement) pull back would be a positive bullish pull back for the SPY chart. The $209-ish area would be something we would have to watch as it would getting close to failing major support.
All the best to your trading success!
Rick | Hit and Run Candlestick Team
Trading knowledge ignites successful stock trading.
Continue Reading
Rick’s Featured Trade Ideas
Today’s featured trade idea and my personal trade plan
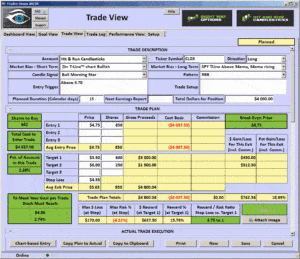
CLDX | Rising trend |RBB | Morning Star signal
SPY: T-Line™ 34ema bullish trend | Market is getting very overbought
 Good Morning, Profit Traders,
Did you know that on June 26, SGY was a members trade idea or how about GORO, CDE, EXK on June 16, could you have made money on these stocks?
Not to take anything away from the bulls; they have dominated the run from June 28th. Friday’s closing candle was a clear Bearish Engulf which is a major warning sign and suggests caution. In the next day or so, if we see selling follow-through below Friday’s low ($215.31), we might want to look at $212.50-ish to $209-ish as possible support areas; both numbers are Fibonacci lines.
The $212.50-ish (23.6% Fib retracement) pull back would be a positive bullish pull back for the SPY chart. The $209-ish area would be something we would have to watch as it would getting close to failing major support.
All the best to your trading success!
Rick | Hit and Run Candlestick Team
Trading knowledge ignites successful stock trading.
Continue Reading


