Public Swing Trade Ideas August 12, 2016
Rick’s Featured Trade Ideas
Today’s featured trade idea and my personal trade plan
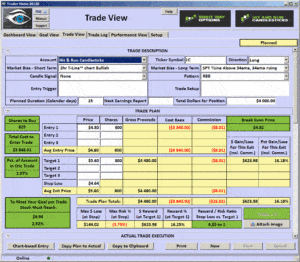
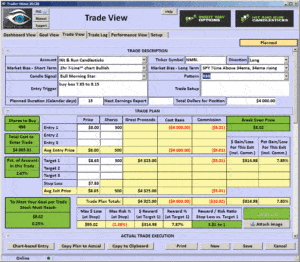
NMBL | RBB | Morning Star |
The T-Line™ is a powerful timing indicator
Retail rallies; oil moves higher. Members are killing it with profits; Hit and Run Candlesticks closed ONC for 60% and EXK for 19%. The market is in a bullish frame of mind with price leading the T-Line™. It’s Friday and we will be surrounded by friends in the trading room today! It just doesn’t get any better than that!
Interestingly, the VIX did not move lower yesterday. Never take your eye off the ball. Always be suspiousis and cautious as it may mean nothing, but the oversold VIX trying to build support while the market moves higher warrants caution while trading long with profits.
All the best to your trading success!
Rick | Hit and Run Candlestick Team
Trading knowledge ignites successful stock trading.
Continue Reading
Public Swing Trade Ideas August 11, 2016 Trader Vision webinar tonight | special update | 8pm EST
Rick’s Featured Trade Ideas
Today’s featured trade idea and my personal trade plan
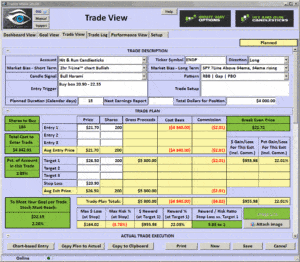
ENDP | RBB | Morning Star breakout |
The T-Line™ is a powerful timing indicator
The Bullish Swing Trading trend is currently being controlled by more sellers than buyers; this can be clearly seen on an hourly chart with lower highs and lower lows. Premarket, the buyers have taken a little control back (for now) from the $217.30 very important support level. The real test for the buyers is if they can close up above $218.60. For the near term, the two important support levels are $217.30 and $216.65.
All the best to your trading success!
Rick | Hit and Run Candlestick Team
Trading knowledge ignites successful stock trading.
Continue Reading
Public Swing Trade Ideas August 10, 2016
Rick’s Featured Trade Ideas
Today’s featured trade idea and my personal trade plan
LC | RBB
Good Morning, Profit Traders,
 The T-Line™ is a powerful timing indicator
The Bullish Trading Trend continues with price closing over the T-Line™, even while we are below $218.76. Of course, a breakout is needed to keep the bull alive. If price were to close below $216.75, I would have a little concern about the Bullish Trading Trend. Both the 2-hour and the 4-hour charts still show the bull is in charge. Two concerning factors are the weakening market participation and volume. (Welcome to August)
All the best to your trading success!
Rick | Hit and Run Candlestick Team
Trading knowledge ignites successful stock trading.
Continue Reading
Bearish Kicker Candlestick Pattern
Last Updated: August 9, 2016
A huge news story can act as a “kick in the butt” for investors. Whether the event involves a change in company management, hype surrounding the announcement of a new product or service, or a worldwide news story, the resulting change in investor sentiment can cause prices to fly up or jump down. In some of these instances, a Bearish Kicker candlestick pattern will occur. This two-candle signal announces that investors have changed their minds about a stock, causing it to gap down and then continue falling in price. It is a very influential and powerful signal, so you would do well to heed its warning! But first, you will need to learn how to identify it, understand it, and interpret its formation . . .
Continue Reading
Public Swing Trade Ideas August 9, 2016 Public e-Learning tonight 8pm EST | Room #2
Rick’s Featured Trade Ideas
Today’s featured trade idea and my personal trade plan
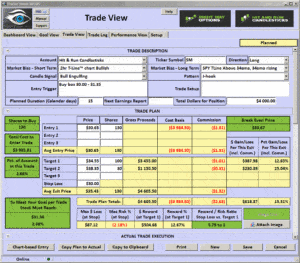
SM | 2 bar PBO | J-Hook breakout | Bullish Engulf
The T-Line™ is a powerful timing indicator
The bulls/buyers still control the market allowing bullish pullback that for now can be bought when signs of buying come back in. Important support areas for the short term are $217.45-ish and $216.75-ish. If these areas are tested, they could be good buying areas with the right positive candle pattern. Short-term target for the SPY is $219.55.
All the best to your trading success!
Rick | Hit and Run Candlestick Team
Trading knowledge ignites successful stock trading.
Continue Reading


