HRC Member’s – Go to the members’ area for today’s stock picks Members Link
Double Digit Gainers
We have 5-15 double-digit trade ideas every month. A $4000 investment in NUGT would have put $1926.40 in your pocket or 51.14% Friday.
Don’t miss the 15% SAVINGS – Click Here
One of Rick’s Featured Trade Ideas Today
Today’s featured trade idea and my personal trade plan
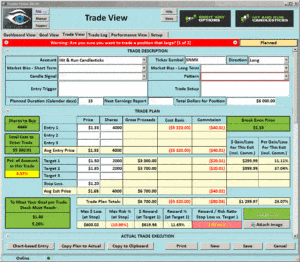
SNMX Long
Conditions: Trending | 3-day Flag | 3-day J-Hook | Inverted H&S-Bullish
 From a bull’s eye:
Using the T-Line as a trend direction indicator has proven to be one of the most important tools for a swing trader. As of yesterday’s close, the T-Line is telling us the bulls still control the trend.
Once you know what the trend is doing it becomes easy to swing trade price action.
The ETF – $GLD may see some weakness today and the Dollar $UUP may show a little strength today.
Member’s Stock Picks Below
Members Daily Trade Ideas. Be aware of sudden market changes!
Today’s stock picks are reserved for subscribed members
Continue Reading
Double Digit Gainers
We have 5-15 double-digit trade ideas every month. A $4000 investment in NUGT would have put $1345.90 in your pocket or 35.73% Friday. Learn to Swing Trade and learn from true Profit Traders?
Don’t miss the 15% SAVINGS – Click Here Ends 2-10-2017
One of Rick’s Featured Trade Ideas Today
Today’s featured trade idea and my personal trade plan
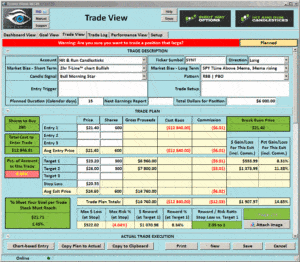
SYNT Long
Conditions: Trending | RBB Breakout | Bullish Morning Star
 From a bull’s eye:
The bulls had a great showing Friday with the SPY up .69% closing above the T-Line. The weekly chart has painted a near perfect ascending triangle with a breakout suggesting the bulls are after more. Remember the trend is your friend and all the western and candlestick signals and patterns guide you within the trend.
The ETF – $GLD continues to show signs of bullishness and the Dollar $UUP is still in a decline.
Member’s Stock Picks Below
Members Daily Trade Ideas. Be aware of sudden market changes!
Today’s stock picks are reserved for subscribed members
Continue Reading
Double Digit Gainers
We have 5-15 double-digit trade ideas every month. A $4000 investment in CSX would have put $876.00 in your pocket Yesterday. Learn to Swing Trade and learn from true Profit Traders? Click Here and save 15%
Our CLVS is now up 47% or $1884.00 with a $4000. investment
One of Rick’s Featured Trade Ideas
Today’s featured trade idea and my personal trade plan
We highly recommend all traders keep a watch list of the best chart patterns and have it ready at all times. Personally, I keep all the members trade ideas, filter all the non-performers out and add good chart setups to it.
By doing this your able to trade the cream and this is how you bring the double-digit winners to your table. I currently have 18 double-digit winners from the daily members trade ideas.
From a bull’s eye:
$226.60 remains intact-The bulls were able to defend $226.60 yet another day!
One of my favorite charts is the 3-day chart, when I look at the SPY I still see a chart controlled by the bulls (with a few minor cracks if you look at a couple indicators) with a bullish breakout and a 2 bar pullback that suggest profit taking until support is broken.
The ETF – GLD Do you see the 2 and 3-day Moring Star?
Member’s Stock Picks Below
Members Daily Trade Ideas. Be aware of sudden market changes!
Today’s stock picks are reserved for subscribed members
Continue Reading
 From a bull’s eye:


