Stalemate at Resistance

Stalemate at Resistance

StalemateAs the Bull worked to push the markets higher yesterday, the Bears battled them to a stalemate at price resistance.  Unfortunately, they left behind the potential topping candle patterns on the DIA, SPY, and QQQ.  At resistance, the Shooting Star Candle Pattern should give a little pause and raise our caution levels.  However, a single candle pattern is only a very short-term clue.  To increase the importance of a shooting star pattern, it must follow-through with bearish price action.

As a result, there is reason for traders to approach the market this morning with a little caution but no need to run for the hills in panic.  After such a strong rally where the Dow has gained nearly 850 points from last Wednesday’s low a simple consolidation at the highs is certainly possible.  Give price resistance respect and stay focused on price action.  If you can lock in some profits to reduce risk and be careful not to load up on new risk because a stalemate can shift directions very quickly.

On the Calendar

We have had it easy so far this week, but today on the Economic Calendar we have three potential market-moving reports.  At 10:00 AM forecasters expect Existing Home Sales to increase to 5.420 million in July.  Then at 10:30 AM we will get the result of the unforecast EIA Petroleum Status Report.  Last but not least the FOMC will release their minutes from their last meeting at 2:00 PM.

On the Earnings Calendar, we have a slightly lighter day, but some name reports that could move the market.  Before the bell LOW, TGT & MOMO report with JBSS, HTHT & LB fessing up after today’s market close.

Action Plan

The Bulls managed to rally yesterday setting a new record high close for IWM.  The SPY ran up and printed a new record but unfortunately was unable to hold on to it by the closing bell.  Shooting star candle patterns were left behind in the DIA, SPY, and QQQ as Bears worked to defend resistance levels.  Futures which were down more than 100 points during the evening hours have recovered substantially now indicating a flat open.

I think it would be wise to exercise a little caution this morning with the battle at resistance in full swing.  Keep in mind with the FOMC minutes released at 2:00 PM we could see the light choppy price after the morning rush as the market waits.

Trade Wisely,

Doug

[button_2 color=”green” align=”center” href=”https://youtu.be/E4VpUG09Spk”]Morning Market Prep Video[/button_2]

8-21-18 Member E-Learning

A Look at Today’s Market (and Your Charts)

In this video, Rick Saddler discusses the current market conditions and reviews many charts, talking about the current setup and how to analyze a potential trade.

1 hour 5 minutes

Candlesticks • Price Action • T-Line • T-Line Bands • Support • Resistance • Trend • Trendlines • Chart Patterns • Buy Box • Volatility Stops • Profit Zones • Entry Zones • Protective Stops • RBB Rounded Bottom Breakout Strategy • Pop Out of The Box Strategy • Pinball Strategy • Trade Planning, Fibonacci, Stoch/RSI

[video_player type=”embed” style=”1″ dimensions=”custom” width=”640″ height=”480″ align=”center” margin_top=”0″ margin_bottom=”20″ ipad_color=”black”]PGlmcmFtZSBzcmM9Imh0dHBzOi8vcGxheWVyLnZpbWVvLmNvbS92aWRlby8yODYxMzg0MzQiIHdpZHRoPSI2NDAiIGhlaWdodD0iNDgwIiBmcmFtZWJvcmRlcj0iMCIgd2Via2l0YWxsb3dmdWxsc2NyZWVuPSIiIG1vemFsbG93ZnVsbHNjcmVlbj0iIiBhbGxvd2Z1bGxzY3JlZW49IiI+PC9pZnJhbWU+Cg==[/video_player]

Investing and Trading involve significant financial risk and are not suitable for everyone. No communication from Hit and Run Candlesticks or it’s associates should be considered as financial or trading advice. All information is intended for Educational Purposes Only. Terms of Service

[testimonials style=”8″ margin_top=”” margin_bottom=””][testimonial name=”Alan%20Helmstetter” company=”” href=””]%3Cp%3EI’ve%20been%20managing%20my%20own%20money%20for%20many%20years%20and%20have%20been%20interested%20and%20dabbled%20in%20trading%20stocks.%20I%20joined%20some%20services%20over%20the%20years%2C%20but%20none%20worked%20for%20me.%20I%20am%20getting%20closer%20to%20retirement%20and%20wanted%20to%20learn%20more%20about%20trading%20stocks%20as%20something%20to%20do%20in%20retirement%20and%20to%20supplement%20income.%20I%20learned%20all%20about%20candlesticks.%20Did%20much%20paper%20trading%20of%20stocks.%20Results%20were%20good%2Fbad%20and%20never%20got%20ahead.%20Came%20across%20a%20free%20HRC%20webinar%20and%20really%20liked%20the%20approach.%20Joined%20a%20month%20trial%20and%20also%20attended%20an%20RWO%20webinar.%20Decided%20to%20join%20RWO%20because%20of%20the%20options%20approach%20and%20have%20been%20a%20member%20for%20four%20months.%20Rick%20and%20Doug%20are%20the%20real%20deal.%20Both%20are%20amazing%20at%20reading%20charts%2Fprice%20as%20well%20as%20teaching%20their%20expertise.%20In%20the%20daily%20chatroom%20you%20will%20get%20potential%20trades%2C%20but%20more%20importantly%2C%20you%20will%20become%20part%20of%20a%20team%2C%20learn%20how%20to%20identify%20trades%20and%20even%20more%20importantly%20how%20to%20properly%20plan%20and%20manage%20trades.%20You%20know%20the%20adage%20–%20%22You%20give%20a%20man%20a%20fish%2C%20and%20you%20feed%20him%20for%20a%20day.%20You%20teach%20him%20to%20fish%2C%20and%20you%20give%20him%20an%20occupation%20that%20will%20feed%20him%20for%20a%20lifetime.%22%20%3Cstrong%3EGive%20them%20a%20try%20you%20will%20not%20regret%20it!%3C%2Fstrong%3E%3C%2Fp%3E%0A

[/testimonial][/testimonials] [button_1 text=”We%20Have%20Monthly%2C%20Quarterly%2C%20Semi-Annual%20and%20Annual%20Memberships” text_size=”29″ text_color=”#000000″ text_bold=”Y” text_letter_spacing=”0″ subtext_panel=”Y” subtext=”Click%20To%20See” subtext_size=”15″ subtext_color=”#f72626″ subtext_letter_spacing=”0″ text_shadow_panel=”N” styling_width=”40″ styling_height=”30″ styling_border_color=”#000000″ styling_border_size=”1″ styling_border_radius=”6″ styling_border_opacity=”100″ styling_gradient_start_color=”#56cf4e” styling_gradient_end_color=”#56cf4e” drop_shadow_panel=”N” inset_shadow_panel=”N” align=”center” href=”https://hitandruncandlesticks.com/hit-and-run-candlesticks/” new_window=”Y”/]

Trade Alert

Good Afternoon Team.

During the live session today Dish alerted up to a pop out of the box pattern. The stock is still under some resistance so take that into consideration if you decide to enter this position.  Consider the DISH the OCT 32.5 Calls to establish a directional position.  An initial conditional stop $34.45.

Remember all trade ideas are for your evaluation and consideration.

Trade Alert

Good Morning team.

Ad the market moves toward resistance I would like to pickup a little negative delta just in case the market fails.  The NASDAQ looks the most vulnerable at the moment so I want taking a look at Tech I think ADBE is looking weak.

This trade is early because we have no failure pattern as of now but the rally has moved right back up into resistance and downtrend.  Because it early please feel free to wait on entering this trade idea.  Consider selling the SEP 262.5 Calls and Buying SEP the 267.50 Calls creating a Bear Call Credit Spread.  Try to get $1.20 or better in the Credit.  A close above $257 would be the stop out area to consider.

Remember all trade ideas are for your evaluation and consideration.

HZNP Setup and Trade Plan

Today’s Featured Trade Idea is HZNP.

Members can hear Rick’s detailed review in the trading room at 9:10am Eastern.  For now, here is my analysis and a potential trade plan made using our Trader Vision 20/20 software.

HZNP is working on a PBO with a very reasonable 23.6% pullback after a strong run higher. The bulls seem to be stepping back in now the last couple days.

However, to be conservative, I will look require the trade to b/o of the J-hook pattern to prove the Bulls are in control again. Since the Entry is 3.5% higher, my Stop will be below Monday’s candle and Targets are Fib. Ext. that match some Weekly S/R level.

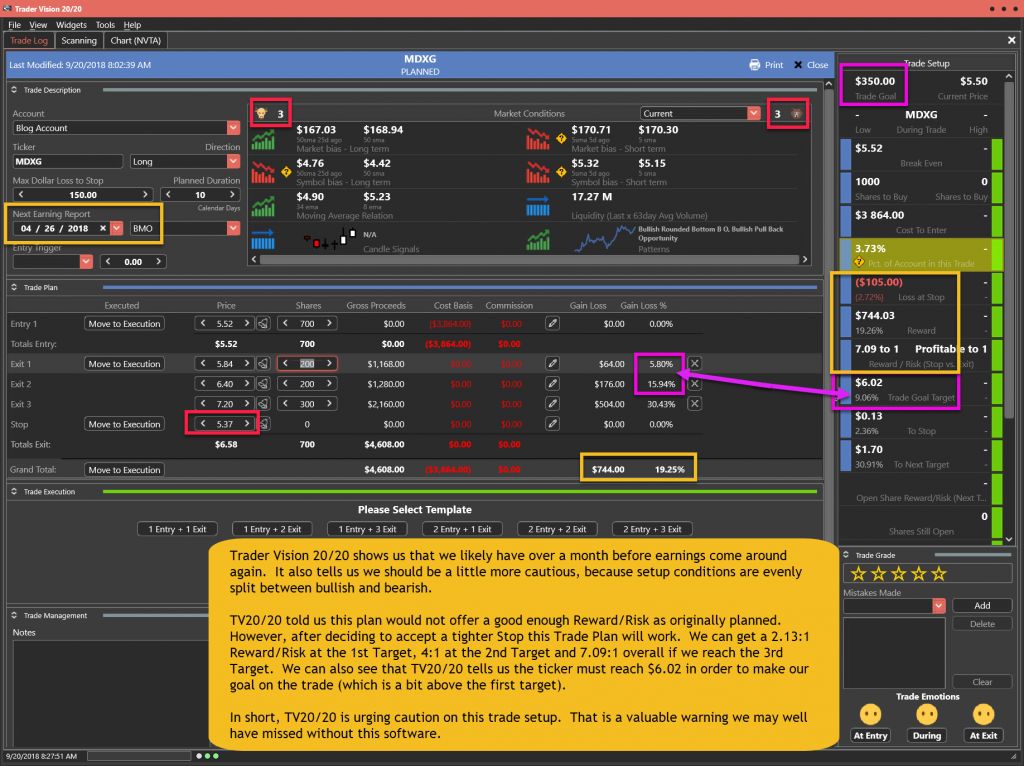
Trader Vision 20/20 shows us that earnings are out of the way. It also tells us that we have 5-6 Bullish conditions with no Bearish conditions in this Chart Setup.

TV20/20 tells us this plan can achieve our Trade Goal prior to reaching the 1st Target. However, we will get 2.45:1 Reward/Risk at that 1st Target. If we sell 100 shares there and can hold the rest to sell at the 2nd Target, we achieve almost 3:1 Reward/Risk ($455/$152).

This would be a nice little 12% trade and it assumes waiting on b/o confirmation. So it is a bit more conservative on Entry.

Having this knowledge before a trade is even entered makes it much easier to control emotions and maintain discipline.

Below is my markup of the chart and the trade plan as laid out by Trader Vision 20/20.  As a bonus, if you click the green button below, you’ll be able to watch a video of the chart markup and trade planning process.

The HZNP Trade Setup – As of 8-20-18

HZNP Chart Setup as of 8-20-18

The Trade Plan

HZNP Trade Plan for 8-21-18

Note how Trader Vision 20/20 does so much of the work for you.  Knowing the ratio of Bullish Conditions to Bearish ones as well as the overall risk of the position size, risk to Stop out and the Reward possible at each Target price can help a great deal with controlling our emotions.  Knowing the dollar impact of every scenario ahead of time, allows us to make calm decisions during the trade.  It really takes the pressure off.  No guesswork.  No surprises.  No emotional roller coaster.

To see a short video of this trade’s chart markup and trade planning, click the button below.


[button_2 color=”light-green” align=”center” href=”https://youtu.be/W3DiiB040G8″ new_window=”Y”]Trade Plan Video[/button_2]


Put the power to Trader Vision 20/20 to work for you…

[button_2 color=”orange” align=”center” href=”https://hitandruncandlesticks.com/product/trader-vision-20-20-monthly-subscription2/” new_window=”Y”]TV20/20 Software[/button_2]


Testimonial

Trader Vision immediately simplified the process…immediately it provided that information and guidance to me. I knew what I would risk for how much reward, I began taking trades off at the 1st target, 2nd target, I was no longer holding all my trades for the homerun. I also began implementing the stop losses if and when they were reached, not just hoping the stock would recover.  It then became easier to see what patterns were working for me and which were not.  It provided a much more relaxed and stress-free environment. –Joan G


***************************************************************************************************

Investing and Trading involve significant financial risk and are not suitable for everyone. Ed Carter is not a licensed financial adviser nor does he offer trade recommendations or investment advice to anyone. No communication from Hit and Run Candlesticks Inc. is to be considered financial or trading advice. All information is intended for Educational Purposes Only. Terms of Service.

***************************************************************************************************

Wall of worry

Wall of worry

Wall of worryWith the Bulls climbing the wall of worry toward resistance and all-time highs there seems to be a tentativeness in their pace.  Perhaps is the just the summer doldrums with August vacations robbing volume or perhaps such fast rally without a confirmed US/China trade agreement has the Bulls questioning current valuations.  Consumer defensive stocks continue to trend higher as do consumer staples and utilities are raising my concern there is a rotation toward safety.

My genuine hope is that the Bulls win the day and market enjoys a solid breakout rally.  However, there are clues of caution that we should not ignore.  Plan your risk carefully and be careful not to over-trade as the market creeps toward resistance.  In my opinion, the QQQ currently appears the most vulnerable to a Bear attack so come on Bulls chug an energy drink and get moving.

On the Calendar

A very light day on the Economic Calendar today.  We start with the Redbook at 8:55 AM Eastern and end with a 4-Week Bill Auction with nothing in between.

On the earnings Calendar, there are 32 companies stepping up to report results today.  Before the bell, we will hear from, KSS, MDT, SJM & TJX.  After the bell, JKHY, LZB, JRJC & MYGN will report.

Action Plan

Asian markets we up overnight as the US and China continue to work on a trade agreement.  Currently, European markets are mostly bullish with the FTSE basically flat on the day.  US Futures are pointing to a bullish open this morning as the Bulls continue their tentative push higher.  The Dow closed above its March high while the SPY inched its way toward price resistance and new record highs.  IWM also seems content to climb the wall of worry, as it grinds toward resistance.  Although holding at its uptrend, the QQQ’s appear to be struggling and will be watching closely for failure clues.

Getting this close to a record high in the SPY I want to believe the bulls will get the job done but I also have to give respect to resistance.  After all, double top patterns develop in the same way.  As a result, we need to keep a close eye on price action as we climb this wall of worry.  There are a lot of very good looking charts but be careful in loading up on to much risk given the overall market condition.  At the moment the QQQ’s seem the most vulnerable to a Bear attack and should be closely watched.

Trade Wisely,

Doug

[button_2 color=”green” align=”center” href=”https://youtu.be/hQ87MmJW51s”]Morning Market Prep Video[/button_2]

J-Hook PBO Continuation Pattern HZNP • Bullish swing trade above $21.05 • Stop 20.40

J-Hook PBO Continuation Pattern

The past eleven days HZNP has been constructing a J-Hook PBO Continuation Pattern. The breakout of $18.00 sent HZNP on a 14.5% run followed by a rest and profit taking. Once again the T-Line and Price Action have teamed up to work together. The past four days price action and with the help of the T-Line has printed four higher lows within a J-Hook continuation pattern. A breakout of $21.05 would set the J-Hook pattern in motion, bullish follow through would suggest the buyers are looking for the next higher levels for profit taking.

Trading Tip – Sell or trim some profits off as price reaches important levels.

Past performance is not indicative of future returns

Good Trading, Rick, and Trading Team


This link takes you to a project account that Rick started so members and students could see how it works Monthly Trading Results updated the first week of each month. 2

What will Rick and Members be looking at today? A 246% plus increase in 7 months can’t be all wrong. Start your trading education with one of our services.

Stocks • Options • Futures

[button_2 color=”red” align=”center” href=”https://hitandruncandlesticks.com/become-a-member/” new_window=”Y”]1 Year Futures Trading and Education Service – Sale Ends 8/31/18[/button_2]

____________________________________________________________

SPY • 3-Day Morning Star Signal

The SPY closed higher yesterday with three higher lows and highs in line with August 7, 8, 9. The premarket this morning has come less the 1% of smacking the January 2018 high. Our Red, White and Blue chart, (3,8, and 34 MA’s) suggest the bullishness is alive and well as of yesterdays close. Price action with the higher highs and lows also suggest the same. Using candlesticks price action on the 3-day Morning Star signal, about $283.50 is our support line. Of course, a close above $286.60 would put the SPY at an all-time new high. This week we have FOMC meeting and the Jackson Hole meeting.

The T-Line

With Price, the action was closing higher yesterday, and the T-Line following the T-Line also made a new high the T-Line has made an ALL TIME NEW HIGH closing at $284.05 yesterday.

****VXX – Price action fell back and closed below the T-Line last week, as long as the price is below the T-Line and 34-EMA fear will stay cold.

Focus Trading Education

Candlesticks • Price Action • T-Line • T-Line Bands • Support • Resistance • Trend • Trendlines • Chart Patterns • Buy Box • Volatility Stops • Profit Zones • Entry Zones • Protective Stops • RBB Rounded Bottom Breakout Strategy • Pop Out of The Box Strategy • Pinball Strategy • Trade Planning, Fibonacci, Stoch/RSI

Subscription PlansPrivate 2-Hour Coaching

Testimonial

This is not your usual service that sends out a ton of stock recommendations, and then cherry picks the winners to show you how great they are. Hit and Run Candlesticks and Right Way Options are truly educational services. They taught me how to trade not what to trade. The entire team: Rick, Doug, Steve, and Ed are there to help and answer your questions. They are awesome. They cut years off my learning curve. And it’s a team effort. Everyone in the room (all the members) are there to help with invaluable insights and advice. The only service you will ever need. Thanks to all the team for how you have helped me and for all you do. –Jonathan Bolnick

Rare to have a service teach you how they find their choices but, HRC/RWO teach you how to fish instead of fishing for you. And, your ideas are not panned but shared, implemented, or improved. Sharing is caring. –Thomas Bradly


Past performance is not indicative of future returns

Investing and Trading involve significant financial risk and is not suitable for everyone. No communication from Hit and Run Candlesticks Inc, Right Way Option, Trader Vision 2020 or Rick Saddler, Doug Campbell, Ed Carter, Steve Risner is to be considered financial or trading advice. All information is intended for Educational Purposes Only. Terms of Service.

Rick Saddler, Doug Campbell, Ed Carter, Steve Risner is not a licensed financial adviser nor do they offer trade recommendations or advice to anyone.


Price Resistance Hurdle Price Resistance Hurdle

Price Resistance Hurdle

Price Resistance HurdleAfter an exuberant news driven reversal of 700 Dow points, the Bulls face the tough price resistance hurdle to set new record highs in the SPY, QQQ, and IWM.  The current momentum certainly favors the Bulls, but we must always have a healthy respect of resistance and remember that the Bears rarely give up without a fight.  Plan your risk carefully and remember buying at resistance is a risky business if the Bears rally in defense.

Asian markets were mixed but mostly higher overnight while European markets are decidedly bullish this morning.  Consequently, the US Futures are currently pointing to a modestly bullish open.  With a light morning on Earnings Calendar and no major Economic reports standing in the way the path to a breakout appears open if the Bulls can find the energy.

On the Calendar

We coast into this week’s Economic Calendar with a very light day and no expected market-moving reports.  At 11:00 AM we have a Fed Speaker and a Bond Announcement.  Then at 11:30 AM there are two Bond Auctions.

The Earnings Calendar this Monday morning shows 46 companies are expected to report.  The most notable before the bell is EL with AABA reporting after the market close.

Action Plan

After a very volatile week where Wednesday’s panic reversed to jubilation on Thursday moved the Dow 700 points higher to challenge resistance by the close on Friday.  With the Asian and European markets mostly higher, current Dow Futures suggest a bullish open kicking off this weeks trading.  The big question is will the Bull have the energy to punch the SPY, QQQ, and IWM through to new record highs.  The DIA still has a lot of work to do if it intends to set a new record, however, a breakout and hold above the March high certainty setup the opportunity to do so.

It would be great to see the momentum of this current rally breakthrough resistance levels.  However, we must set aside our bias and plan our day with the very real possibility that the Bears could defend price resistance!  After a 700 point 2-day rally, a rest or pullback would not be out of the question.  Remember buying at resistance comes with a higher risk so plan your trades carefully.

Trade Wisely,

Doug

[button_2 color=”green” align=”center” href=”https://youtu.be/kN666rMlsOI”]Morning Market Prep Video[/button_2]