
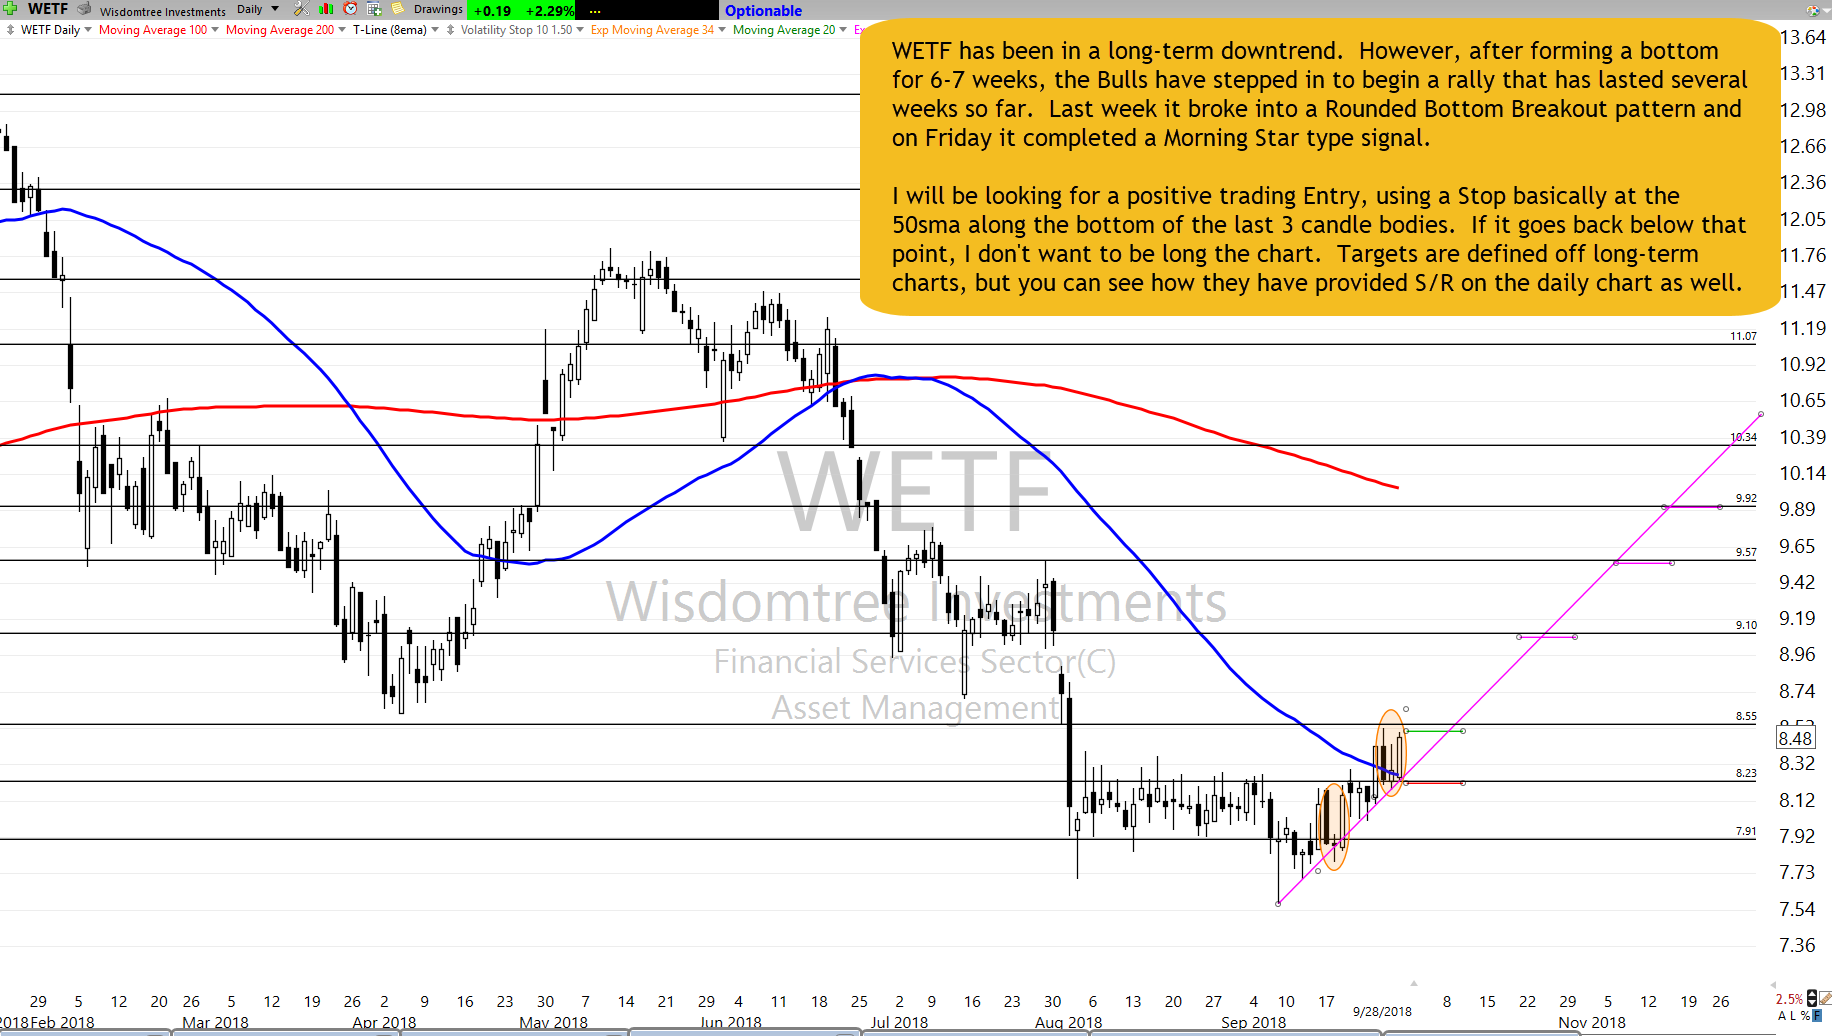
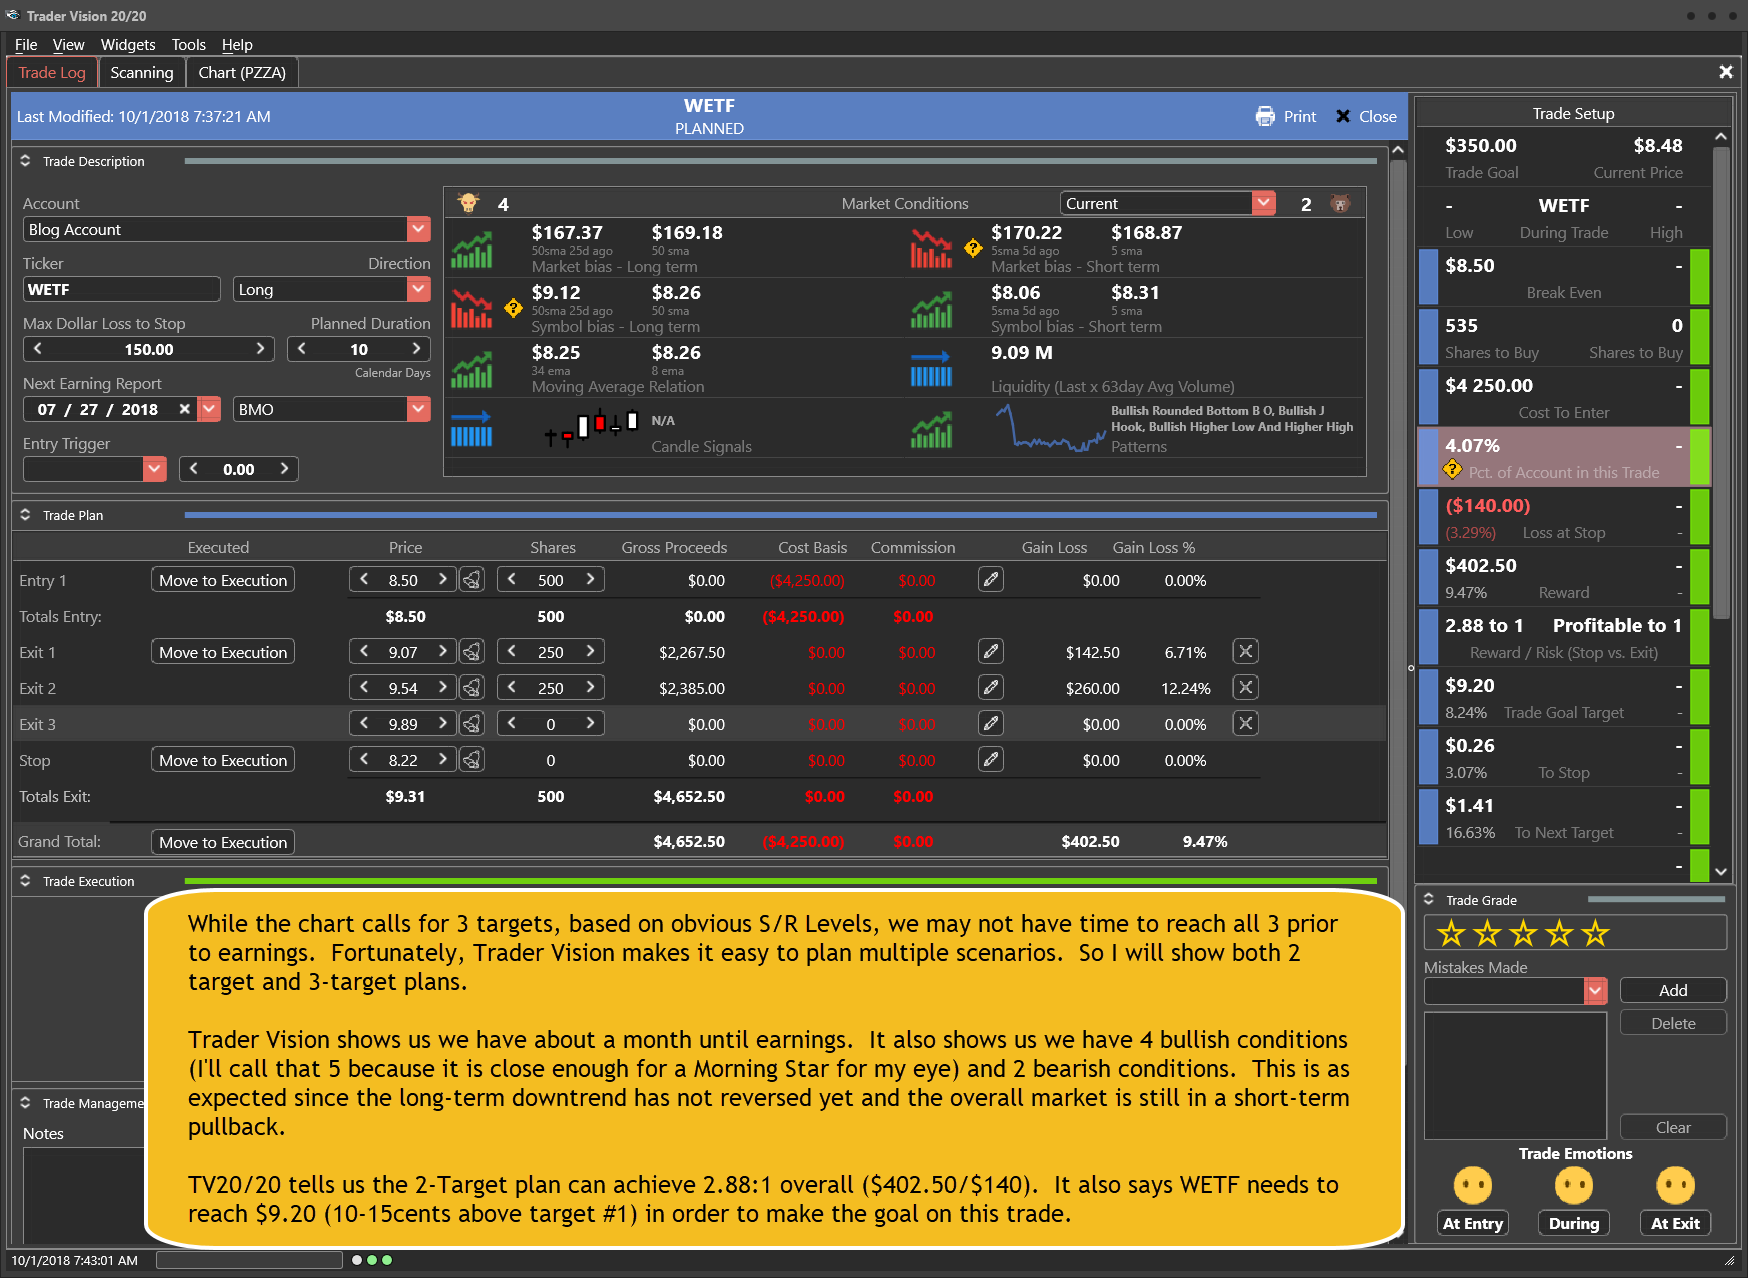
HAL Setup and Trade Plan
Today’s Featured Trade Idea is HAL.
Members can join us in Trading Room #1 as Rick reviews the HAL setup and other Trade-Ideas at 9:10am Eastern. For now, here are my own analysis and a potential trade plan made using our Trader Vision 20/20 software.
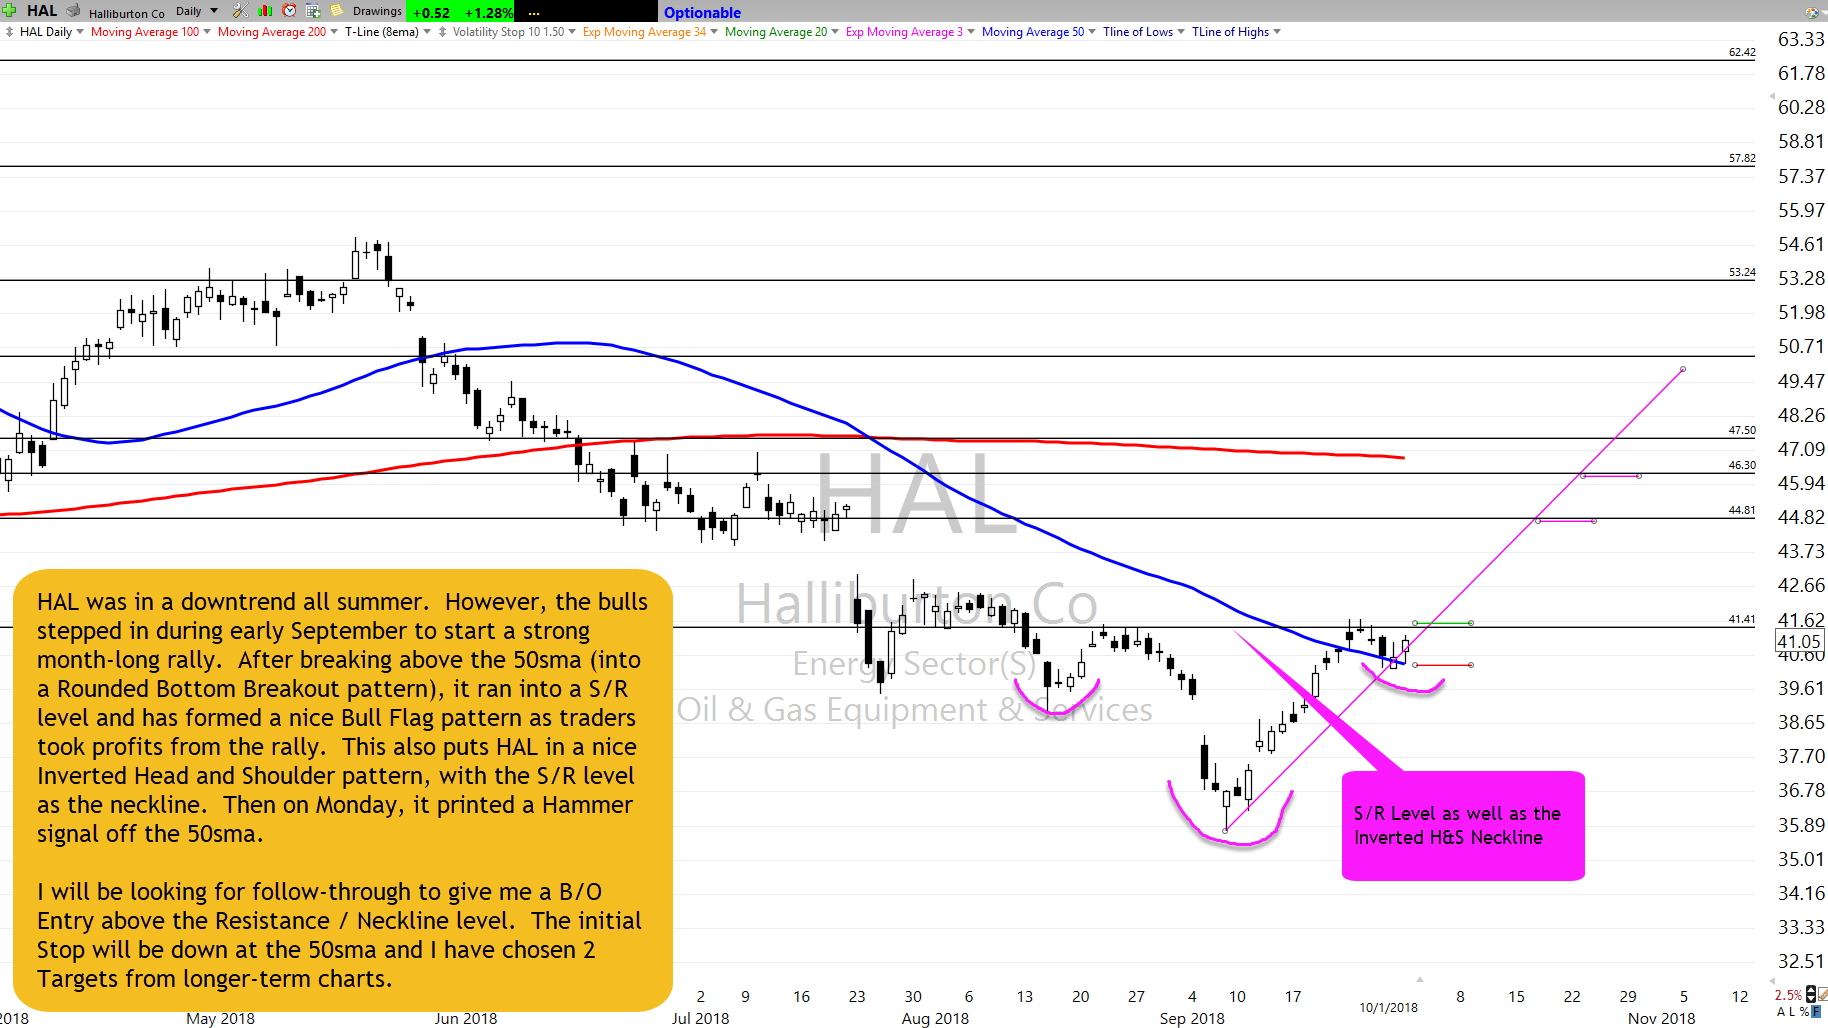
HAL was in a downtrend all summer. However, the bulls stepped in during early September to start a strong month-long rally. After breaking above the 50sma (into a Rounded Bottom Breakout pattern), it ran into a S/R level and has formed a nice Bull Flag pattern as traders took profits from the rally. This also puts HAL in a nice Inverted Head and Shoulder pattern, with the S/R level as the neckline. Then on Monday, it printed a Hammer signal off the 50sma.
I will be looking for follow-through to give me a B/O Entry above the Resistance / Neckline level. The initial Stop will be down at the 50sma and I have chosen 2 Targets from longer-term charts.
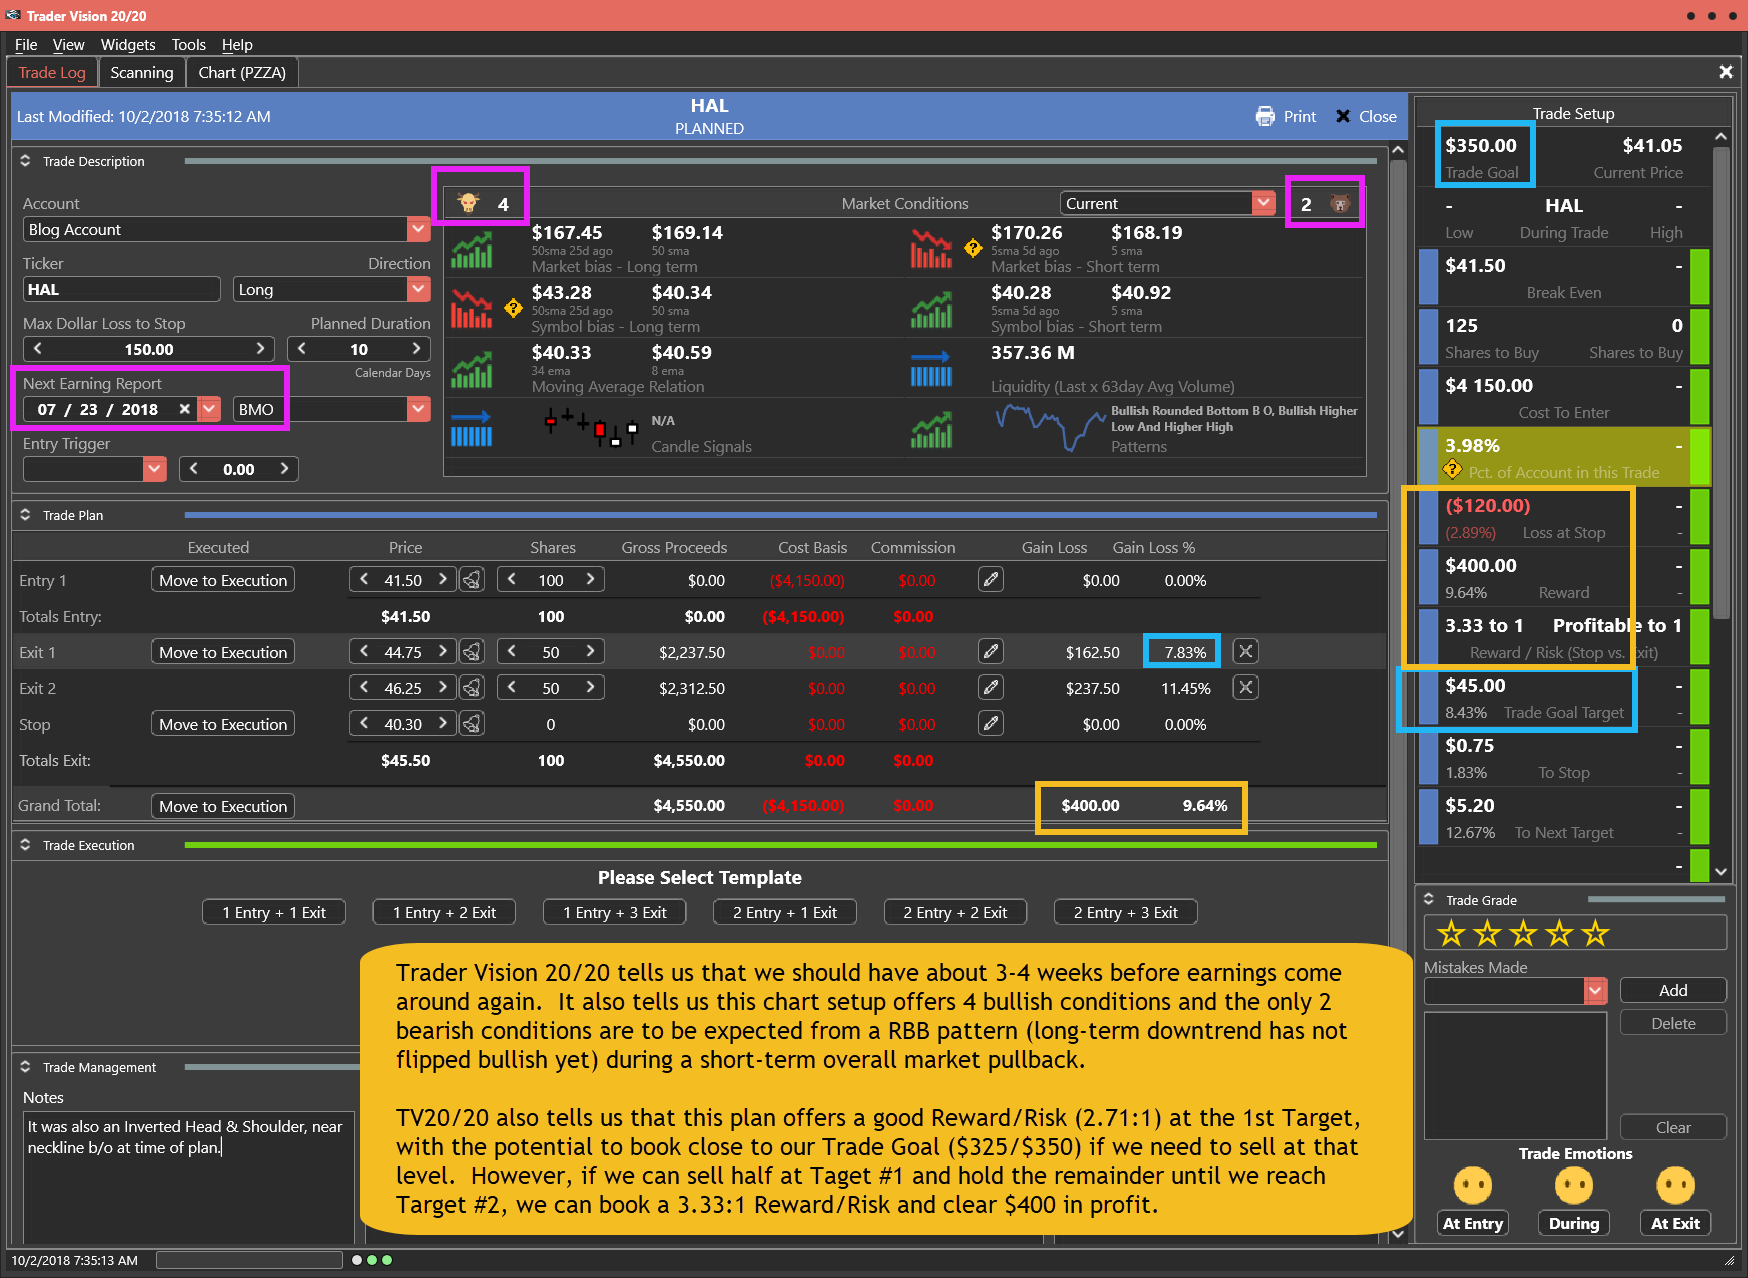
Trader Vision 20/20 tells us that we should have about 3-4 weeks before earnings come around again. It also tells us this chart setup offers 4 bullish conditions and the only 2 bearish conditions are to be expected from a RBB pattern (long-term downtrend has not flipped bullish yet) during a short-term overall market pullback.
TV20/20 also tells us that this plan offers a good Reward/Risk (2.71:1) at the 1st Target, with the potential to book close to our Trade Goal ($325/$350) if we need to sell at that level. However, if we can sell half at Target #1 and hold the remainder until we reach Target #2, we can book a 3.33:1 Reward/Risk and clear $400 in profit.
Having this knowledge before a trade is even entered makes it much easier to control emotions and maintain discipline.
Below is my markup of the chart and the trade plan as laid out by Trader Vision 20/20. As a bonus, if you click the green button below, you’ll be able to watch a video of the chart markup and trade planning process.
The HAL Trade Setup – As of 10-1-18
The Trade Plan
Note how Trader Vision 20/20 does so much of the work for you. Knowing the ratio of Bullish Conditions to Bearish ones as well as the overall risk of the position size, risk to Stop out and the Reward possible at each Target price can help a great deal with controlling our emotions. Knowing the dollar impact of every scenario ahead of time, allows us to make calm decisions during the trade. It really takes the pressure off. No guesswork. No surprises. No emotional roller coaster.
To see a short video of this trade’s chart markup and trade planning, click the button below.
[button_2 color=”light-green” align=”center” href=”https://youtu.be/9QE_6hdH7RI” new_window=”Y”]Trade Plan Video[/button_2]
Put the power to Trader Vision 20/20 to work for you…
[button_2 color=”orange” align=”center” href=”https://hitandruncandlesticks.com/product/trader-vision-20-20-monthly-subscription2/” new_window=”Y”]TV20/20 Software[/button_2]
Testimonial
Trader Vision immediately simplified the process…immediately it provided that information and guidance to me. I knew what I would risk for how much reward, I began taking trades off at the 1st target, 2nd target, I was no longer holding all my trades for the homerun. I also began implementing the stop losses if and when they were reached, not just hoping the stock would recover. It then became easier to see what patterns were working for me and which were not. It provided a much more relaxed and stress-free environment. –Joan G
***************************************************************************************************
Investing and Trading involve significant financial risk and are not suitable for everyone. Ed Carter is not a licensed financial adviser nor does he offer trade recommendations or investment advice to anyone. No communication from Hit and Run Candlesticks Inc. is to be considered financial or trading advice. All information is intended for Educational Purposes Only. Terms of Service.
***************************************************************************************************
 A huge bullish gap to begin the first day of trading of the 4th quarter after inking a new trade agreement between the US and Canada fired up the futures last night. Asian markets closed up across the board, and European markets are currently showing green across the board. As I write this, US Futures suggest a huge morning gap 200 points.
 The light volume choppy rally yesterday was ultimately unable to hold onto gains by the end of the day leaving more questions than answers. There were noticeably fewer companies moving up supporting the rally. There is nothing in the charts that’s particularly bearish, but I do think there is a reason to be a little cautious as we head into the weekend.

