Bulls Leaping Higher
Bulls Leaping Higher

Apple disappointed investors, but news that the US and China are talking positively about inking a trade deal has the Bulls leaping higher for today’s open. As AAPL slides about south 5%, the US futures are indicated to open nearly 300 points higher. Traders still holding short positions at the open will feel the pain of a short squeeze this morning.
At the open today, the Dow will have recovered about 1400 points in just four days. Heading into the weekend and with the mid-term elections just around the corner be careful not chase. Although a trade deal between the US and China could be a game changer for the market by the end of the year, it does not rule out the possibility of profit taking by the end of the day. With about 1500 companies reporting next week and a lot of technical chart damage repair volatility is likely to remain very high so plan your risk into the weekend carefully.
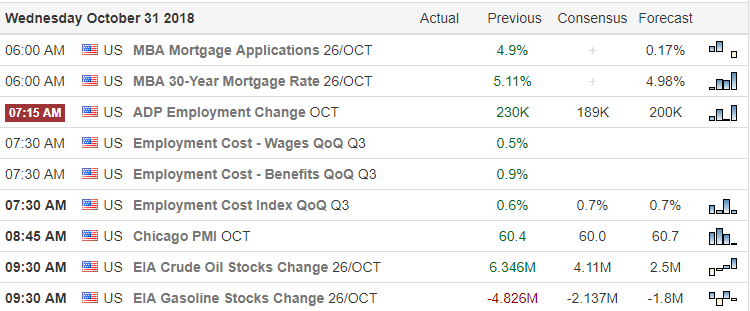
On the Calendar
We get a little break on the Friday Earnings Calendar with just over 100 companies reporting today. Next week more than 1500 companies are expected to report. Notables for today: AAPL, ABBV, AIV, AMH, ANET, APPN, ATHN, AXL, BABA, BLDR, BPL, BRKR, CBOE, CBS, CC, CCJ, CERS, CHEF, CNK, CORT, CRC, CRUS, CVX, DEI, DOC, DUK, EAF, ED, EEP, ENB, EOG, ES, EXEL, EXTR, FLR, FTNT, GPRO, HR, HRC, HST, IMGN, IPHI, ITT, KHC, LADR, LHO, LNC, LYV, MDRX, MELI, MET, MSGN, MSI, MTZ, NFG, NPTN, NWL, OEC, OLED, PBA, PBYI, PE, PEB, PK, PODD, RLGY, RP, SBUX, SEDG, SEP, SHAK, SHLX, SKT, SM, SRCL, SRG, STAG, STX, SYMC, TDC, TDOC, TDS, TEX, TNDM, TRMB, TRTN, TSRO, UNIT, VG, VIAV, VICI, VST, WIFI, WLTW, WPC, WTW, WU, X, XOM
Action Plan
With the news that the US and China are getting closer to inking a trade, the market is leaping higher this morning. That news came at the perfect time as AAPL disappointed investors and is indicated more than 5% lower at the open. Asian and European markets were decidedly bullish overnight and the Dow Futures currently suggesting a gap up nearly 300 points.
A trade deal with China could be a bullish game changer for the end of this year. There is certainly a lot of technical damage in the charts to recover from, but it is possible a true V-bottom pattern could occur. Remember we still have the mid-term elections next week and volatility is likely to remain very high with about 1500 companies scheduled to report earnings next week. The Dow will have recovered about 1400 points in 4 days at the open, don’t be surprised if we see some profit taking ahead of the weekend.
Trade Wisely,
Doug
[button_2 color=”green” align=”center” href=”https://youtu.be/bRqYPJz7xJo”]Morning Market Prep Video[/button_2]
 Markets are once again gaping higher this morning as this wild ride of volatility continues. With nearly 450 companies reporting earnings today and a busy economic calendar, anything is possible. Price resistance did its job yesterday rejecting the days high. This mornings gap brings the price right back up to those same price resistance levels. I intend to very cautious this morning and will watch price action closely to see if this gap is actually going to be supported by buyers.
 Bullishness in the Asian and European market has the US Futures suggesting the first possible follow-through rally in nearly a month! Certainly exciting to see but as the indexes challenge price resistance levels, we can’t rule out the possibility of profit-taking. As a result, traders will need to say on their toes focused on price action and aware of the current market volatility.