Imagen that you are standing at ground level and looking at a rectangular flag on a pole that rises to the sky. The rectangle is sloping down. This visual is what you see on a stock chart when price rises (and breaks out of a resistance level). This resistance level then becomes a support level (ground level) and moves higher in an up trending manner. This price action forms the pole.
Price reaches a level where profit-taking begins and starts to move lower. Price moves lower in a zigzag manner within a downward sloping channel. This downward sloping channel is a flag formation. Traders refer to the price action within the channel as a consolidation.
Typically, up-trending price activity will have a downward sloping flag and down trending price activity will have an upward sloping flag. This makes sense since in an uptrend, profit taking will result in lower prices as traders sell stock. In a downtrend, profit taking will result in higher prices as traders buy stock to cover short positions.
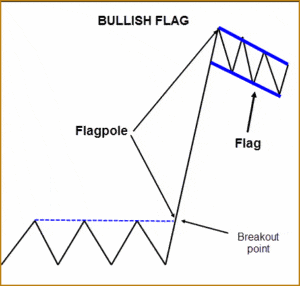
A Bullish Flag looks like this

The flagpole is measured from the price breakout point to the highest price point before the price starts to pull back. The blue dotted line represents the top of a price consolidation area. The flag pole starts when price moves above the blue dotted line. Notice how the flag forms in a descending manner.
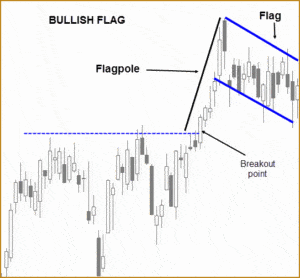
The best way to illustrate a flag formation is by displaying it on a stock chart. Below is an example of a bullish flag on a daily chart.

On the chart above, price breaks out after a 40 day consolidation period. This breakout point starts the beginning of the flagpole. Price advances sharply for 5 days and starts to pull back. Price zigzags lower for 15 days forming the downward sloping flag.
Key points for the Bullish Flag –
The bullish flag is most significant when it appears after a sharp advance in price.
A flag can form over one or more weeks. The most reliable flags typically form over 1-4 weeks.
Ideally, the lowest price point of the bullish flag does not drop below the breakout point. A drop and continuation below the breakout point could signal a change in trend.
Traders wait for a breakout from the flag to confirm that the preceding trend is still in play. It is best not to anticipate a breakout one way or the other. Some consider the flag area to be a “no trade zone”.
Learn TC2000 Scan Coding – Click Here
Learn TOS Scan Coding – Click Here


