
Last Updated: March 27, 2017
There is a positive and a negative to nearly every situation. We’ve already discussed the upside of a Tasuki Gap, so now it’s time for the downside. Occurring at the end of a distinct downtrend, the Downside Tasuki Gap is a bearish continuation pattern. Like the Upside Tasuki Gap, it isn’t particularly common or dramatic, but why not add it to your repertoire regardless? To help you get started, today we’re exploring the formation of the Downside Tasuki Gap candlestick pattern and the meaning it conveys.
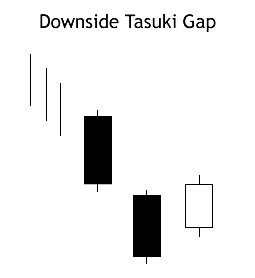
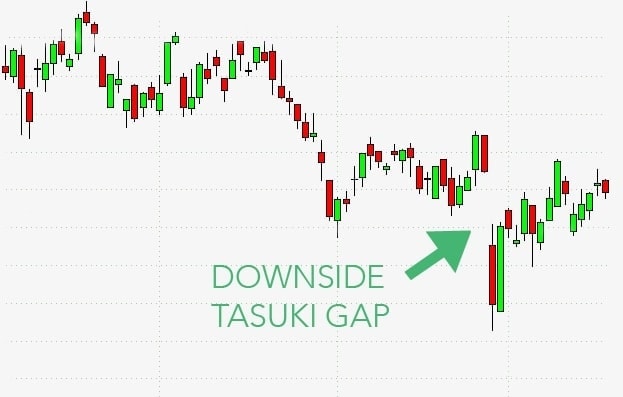
Downside Tasuki Gap
Formation
The Downside Tasuki Gap (also known as the Bearish Tasuki Gap or the Downward Gap Tasuki) is a three-candle continuation pattern. Think you’ve spotted it? To be sure, keep an eye out for the following criteria:
First, a clear downtrend must be present and it must end with a red (or black) candle. Second, that downtrend must gap down to a large red/black candle. Third, a green (or white) candle must follow the red/black candle. Fourth and finally, the green/white candle must open inside the red candle’s real body and close above it. This candle should not close the gap between the first two candles.
Let’s clarify that a bit. So of the three candles involved, the first two will be red/black and the third will be green/white. In order to qualify, the second and third candles must be opposing colors. These second two candles should also be about the same size.
As we mentioned above, the Downside Gap Tasuki does have a brother: the Upside Gap Tasuki. So if you notice the criteria above in the opposite formation (an uptrend followed by a gap up, a green/white candle, and then a red/black candle that opens within the previous candle and closes below it), you’ve almost certainly spotted the Upside Gap Tasuki.
Meaning
All of this is well and good, you might be thinking, but what does it mean?
The pattern’s gap down shows the power of the downtrend; the bears are in control and exhibiting their strength. This downward strength is then amplified, shown by the price being driven lower and a new red candle forming. However, a pause follows this movement as the bulls attempt to force the price up. They take a chance and try their best, but they are unable to close the gap. Because of this failed attempt, we can predict that the bears will regain control and the downtrend will continue.
EXAMPLES
Learning about the form and function of a candlestick pattern is helpful, but do you think you could spot the Downside Tasuki Gap on a real candlestick chart? Just as importantly, could you predict what would likely happen next? To test your training, check out the examples below. Try to ignore the arrows at first, and simply look for the signal on your own. Then, think about what you would do if you, as an investor, had a stake in the outcome of the chart.
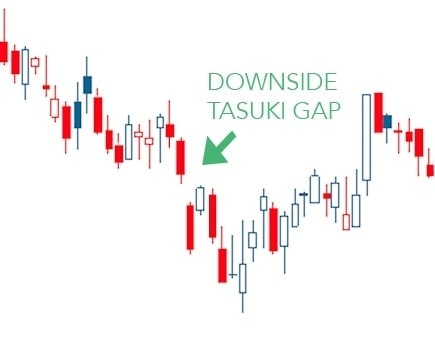
EXAMPLE 1:
When the curtain rises on our first example, a downtrend is in progress. About halfway down the slope, however, a Downside Tasuki Gap occurs. The bears have succeeded in pushing the price down quickly enough for a gap to form. However, the bulls step in then and attempt to raise the price. Although they have enough power to form a white candle that rises above the previous day’s high, they don’t succeed in closing the gap. Their campaign has failed. As expected, the bears take the reins again and continue the downtrend.
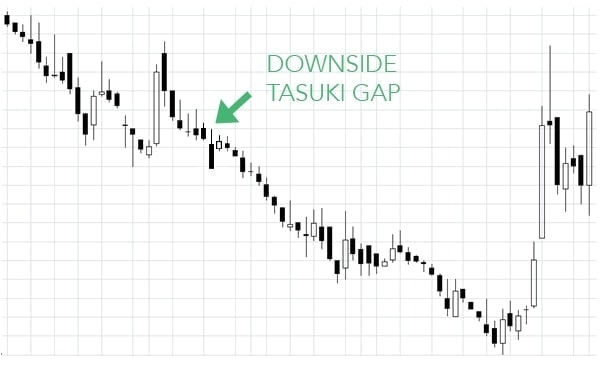
EXAMPLE 2:
Our next example features a larger chart and an impressive downtrend. Shortly after the plummet begins, there is a moment of hesitation. The bears have successfully pushed the price down – with a gap, no less! The price progression pauses when the bulls step in; they manage to propel the price up again, not quite closing the gap. Instead of marking a turnaround, this reveals the bears’ strength. Despite a small setback, they are able to move forward. And in fact, the downtrend continues for a long while, nearly reaching the end of the chart.
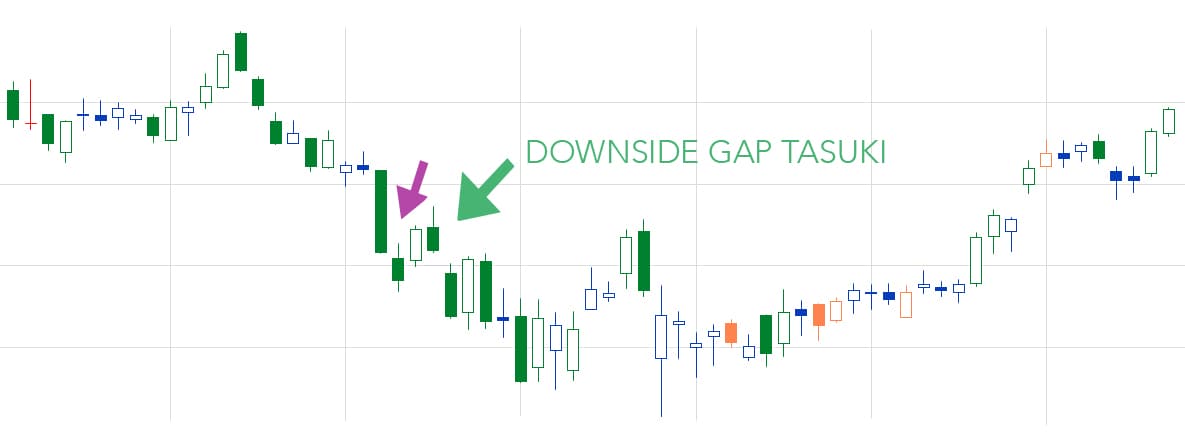
EXAMPLE 3:
In our third example, the price begins to meander downward about one-quarter of the way through the chart. With your eyes peeled for a Downside Gap Tasuki, you might first stop at the spot indicated by the purple arrow. It occurs in the midst of a downtrend, begins with a bearish candle, gaps down to another bearish candle, and finishes with a bullish candle that opens within the previous candle’s body. Looks good, right? Not so fast . . . That last candle closes above the gap, meaning the bulls did not truly fail in their efforts, weakening the effect of the signal.
For a true Downside Gap Tasuki, look to the green arrow. This pattern begins immediately after the faux-Tasuki, still in the course of the downtrend. The first two candles are separated by a gap; the bears are in control and feeling strong. But can it last? The bulls step up to the plate, opening the price within the previous day’s body and then pushing it up into the gap. Their attempt to gain control of the price proves inadequate, and the bears step in once more.
_____
If you spot a Downside Gap Tasuki, don’t act until you have confirmation. To confirm this candlestick pattern, you will need to check that the price is continuing to trade below the gap. Ideally, the price will trade below the green candle’s real body. Once you spot this movement, your confidence in the signal’s meaning should increase, allowing you to make a smart trading move.
Good luck!
If you’re interested in mastering some simple but effective swing trading strategies, check out Hit & Run Candlesticks. Our methods are simple, yet powerful. We look for stocks positioned to make an unusually large percentage move, using high percentage profit patterns as well as powerful Japanese Candlesticks. Our services include coaching with experienced swing traders, training clinics, and daily trading ideas. To sign up for a membership, please click here.


Comments are closed.