
Last Updated: March 17, 2017
Although there may not be an upside to every situation, the presence of an Upside Gap Tasuki surely counts as an upside during an otherwise lackluster market day . . . right? Yes, indeed. The Upside Gap Tasuki is a bullish continuation pattern that occurs in the midst of a strong uptrend. Although this isn’t a particularly common or influential candlestick pattern, it’s certainly worth adding to your Japanese candlestick repertoire. To learn more about its formation and what it says about the current state of the market, simply scroll down.

Upside Gap Tasuki
Formation
The Upside Gap Tasuki (also known as the Bullish Tasuki Gap or the Upward Gap Tasuki) is a three-candle continuation pattern. If you think you’ve spotted an Upside Gap Tasuki, start looking for these criteria:
First, a clear uptrend must be present, ending with a green (or white) candle. Second, that uptrend must gap up to a large green/white candle. Third, a red (or black) candle must follow the green candle. Fourth and finally, the red candle must open inside the green candle’s real body and close below it. Note that the red candle does not need to fully close the gap.
So to clarify, that means that the first two candles must be green/white, and the third candle must be red/black. The second and third candles must be opposing colors to fit in a Gap Tazuki pattern. Finally, the second two candles are typically about the same size.
If you spot a group of candles in the opposite formation (a downtrend followed by a gap down, a black/red candle, and a white/black candle that opens within the previous candle and closes below the previous open), you may have spotted a Downside Gap Tasuki.
Meaning
So what does all this mean? The strength of the uptrend at the start of the Upside Gap Tasuki is conveyed through the gap open as well as the escalating price, which forms into a white/green candle. However, this upward movement is followed by a pause. The bears are attempting to force the price down, but they’re unable to close the gap. From this, we can conclude that the uptrend will likely continue.
EXAMPLES
Hold it! Just because you know what an Upside Gap Tasuki looks like and how to interpret its presence, that doesn’t mean you’re ready to embrace it in your trading strategies. To test your knowledge, review the three examples below. Although we’ve clearly marked the Upside Gap Tasuki patterns with arrows and labels, try to ignore these markers and identify the signal on your own. Then, predict what will happen next.
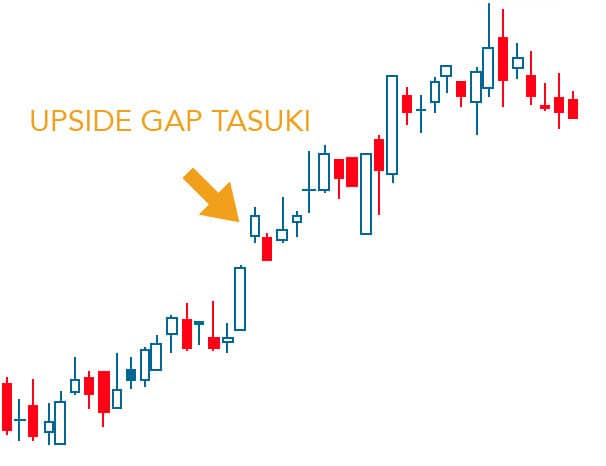
EXAMPLE 1:
One great uptrend dominates this chart, resembling a staircase of candlesticks. In the middle of this escalation, an Upside Gap Tasuki appears. The bulls show their strength with a long white candle, which then gaps up to another white candle. However, they fail to maintain control of the price. The bears sweep in and grab the reins. On this third day, the price opens at the same place it opened the previous day (barely qualifying it as an Upside Gap Tasuki) and then dips. The takeover, however, is brief, and the bears can’t close the gap. As expected, the uptrend continues.
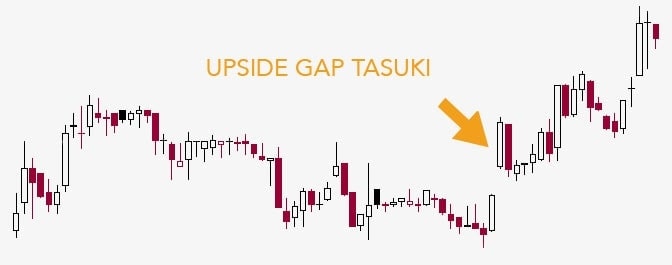
EXAMPLE 2:
We can debate whether this example qualifies as an Upside Gap Tasuki, as it appears at the end of a downtrend. It helps illustrate how tricky it can be to identify candlestick patterns “in the wild.” Let’s assume it does qualify. It begins with a long white candle, a sizable gap, and another long white candle. The third candle is similar to the second in size. The bears are attempting to seize control, but they can barely push the price below the previous day’s open. The uptrend that follows confirms their weakness; they simply can’t compete with the strength of the bulls.
However, since this signal doesn’t adhere to all the criteria of an Upside Gap Tasuki, investors should be reluctant to trust it outright. Waiting for confirmation is even more important than usual.
EXAMPLE 3:
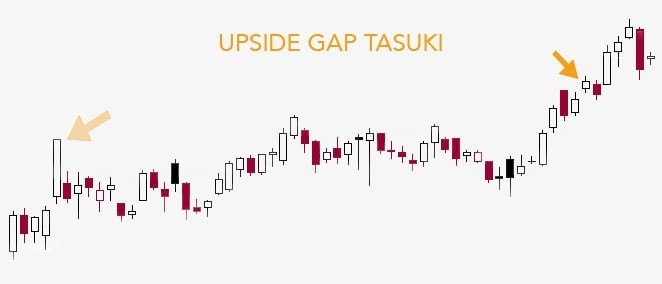
You’ll notice two arrows in our third example: one lighter, one darker. Let’s start with the arrow on the right – the darker arrow. In the midst of a clear uptrend, the bulls continue their journey with two small white candles separated by a small gap. Following the second candle, the bears step up to the plate. The red candle that follows mimics the prior white candle in size. It opens within the range of that previous candle and then dips into the gap – but only slightly. They can’t push much further than that, however, so the bulls take over and carry on with their uptrend.
Now let’s take a gander at the first, lighter candle. It appears to be an Upside Gap Tasuki as well: a white candle, a gap up, another white candle, a red candle that opens within the previous candle’s range and closes below it . . . It is not preceded by an uptrend, however, and an uptrend does not follow the “signal” either. Should we consider this trio of candles an Upside Gap Tasuki? Probably not.
_____
Finally, before you go, we must remind you to always check for confirmation. To confirm an Upside Gap Tasuki, check that the price is continuing to trade above the gap, preferably above the red (or black) candle’s real body.
That’s all there is to it. Good luck!
If you’re interested in mastering some simple but effective swing trading strategies, check out Hit & Run Candlesticks. Our methods are simple, yet powerful. We look for stocks positioned to make an unusually large percentage move, using high percentage profit patterns as well as powerful Japanese Candlesticks. Our services include coaching with experienced swing traders, training clinics, and daily trading ideas. To sign up for a membership, please click here.


Comments are closed.