
Last Updated: August 9, 2016
A huge news story can act as a “kick in the butt” for investors. Whether the event involves a change in company management, hype surrounding the announcement of a new product or service, or a worldwide news story, the resulting change in investor sentiment can cause prices to fly up or jump down. In some of these instances, a Bearish Kicker candlestick pattern will occur. This two-candle signal announces that investors have changed their minds about a stock, causing it to gap down and then continue falling in price. It is a very influential and powerful signal, so you would do well to heed its warning! But first, you will need to learn how to identify it, understand it, and interpret its formation . . .
Bearish Kicker Candlestick Pattern
Formation
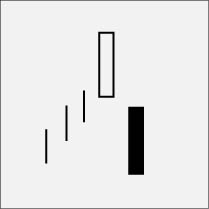
If this is your first time working with a Bearish Kicker candlestick pattern, you will need to know the visual characteristics that define it. To identify a Bearish Kicker, check for the following criteria:
First, there must be a white (bullish) candlestick. Second, the white candlestick must be followed by a black (bearish) candlestick that opens below the first candlestick, forming a gap. Third, the price during the formation of the second candlestick must never rise into the gap. Due to this stipulation, you will rarely find a top wick on the second candlestick.
Although the Bearish Kicker pattern doesn’t need to occur after a lengthy uptrend, it sometimes does, emphasizing the abruptness of the change in investor sentiment. You may also see the opposite formation (a black candle followed by a white candle that gaps up and never drops into the gap), which is known as a Bullish Kicker candlestick pattern.
Meaning
When the first candlestick opens, the price has an upward direction and that rising movement continues throughout the day. However, the following day’s candlestick, while opening at or near the previous day’s open, continually moves the price downward. The price never rises into the previous day’s trading range, causing a gap. Due to this significant change in direction, it’s usually safe to assume that the second candlestick’s downward movement will continue for a fair amount of time.
Bearish Kickers often appear after a startling news event that causes an abrupt change in investor sentiment before or after market hours. It is most relevant when it forms in an oversold or overbought area, but regardless of the area or trend, the gap between the candlesticks illustrates a strong and meaningful change. There is a high level of selling pressure as well.
Once you know the basic formation, you can watch out for unique elements that tell you more about the pattern’s prediction. To better understand the Bearish Kicker candlestick pattern, look for these characteristics:
- The longer the candlesticks, the more dramatic the reversal.
- The larger the gap, the more significant the reversal.
Examples
Now that you’ve learned the basic formation and meaning of a Bearish Kicker candlestick pattern, it’s time to put your skills to the test. After all, just because you understand what the signal looks like and what it expresses about current investor sentiments, that doesn’t mean you can translate your knowledge to the real world. In the examples below, could you identify the Bearish Kickers even without the handy labels? Could you describe what the pattern conveys about the market? Review the examples below to further your Japanese candlestick education.
EXAMPLE 1:
As you can see, near the middle of the chart, an enormous green candle conveys a huge jump in price. Following this upward spike, there is a short dip before a solid uptrend emerges. Five green candles mark this trend, and the last candle forms the first half of the Bearish Kicker. Following a gap down, we see the second half of the signal: an extremely long, red candlestick. As expected, this reversal heralds the start of a downtrend. The price drops and (for the remainder of the chart’s tracking period) never again reaches the height it had before the Bearish Kicker entered the scene.
EXAMPLE 2:
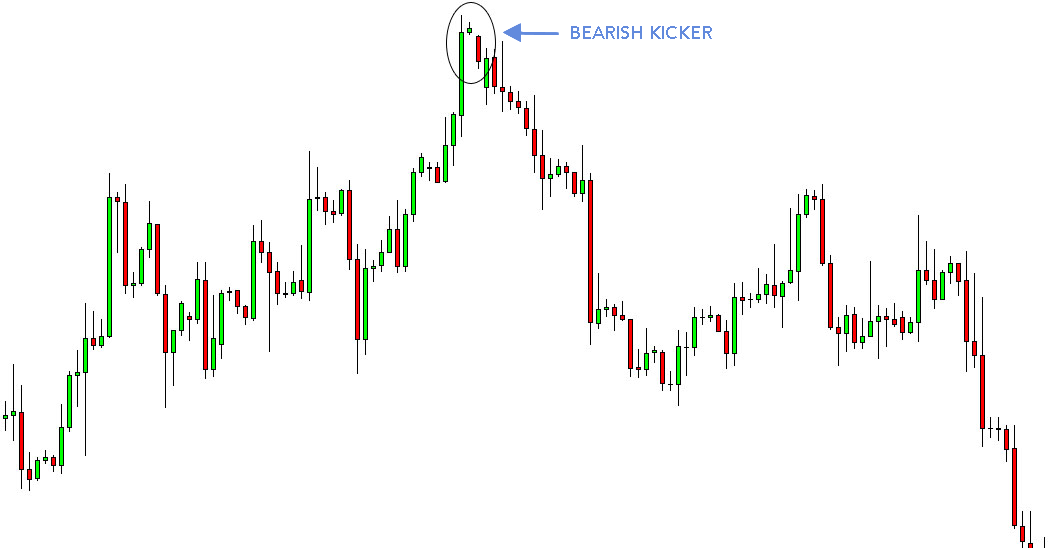
In our second example, despite some dips and red candles, the market progressed steadily upward for the first half of the chart. Even at the very end of this uptrend, just before the tide turns, a tiny candle marks another small upward push. However, that candle is the start of a Bearish Kicker, which concludes the uptrend with a relatively short red candle. Although the price doesn’t drop immediately (and the subsequent green candle doesn’t confirm the reversal), it soon slips down with a series of minuscule red candles. After a somewhat stable period, a huge red candle amplifies the strength of the downtrend. We’ve come a long way down from the market’s earlier heights.

EXAMPLE 3:
In this third example, you can spot both a Bearish Kicker and a Bullish Kicker. After a very short upward spurt near the center of the chart, which begins with a significant gap, the Bearish Kicker appears, and the minor uptrend reverses into a downtrend. Following another gap (moving down this time), the Bullish Kicker steps into action. Its first candle dips down to mark the lowest price on the chart. Then, after a small gap, its second candle appears. As predicted, this signals the start of an uptrend.
– – – – –
Because it indicates such a strong change in investor sentiment, the Bearish Kicker should never be overlooked. In fact, some describe Kicker patterns as the most powerful Japanese candlestick signals of all! As always, however, be sure to confirm your suspicions before you make your next move. A red candle or a gap down can give you greater confidence in the Bearish Kicker’s forecast and increase your peace of mind.
Good luck!
If you’re interested in mastering some simple but effective swing trading strategies, check out Hit & Run Candlesticks. Our methods are simple, yet powerful. We look for stocks positioned to make an unusually large percentage move, using high percentage profit patterns as well as powerful Japanese Candlesticks. Our services include coaching with experienced swing traders, training clinics, and daily trading ideas. To sign up for a membership, please click here.


Comments are closed.