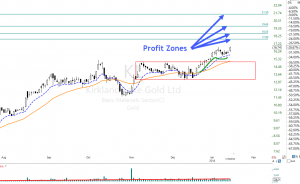
J-Hook Continuation Pattern
 KL has recently run about 24% and has pulled back managing to find support above the Lower T-Line Band and the V-Stop. The chart pattern is a J-Hook Continuation pattern. The overall chart trend remains bullish while Gold is bullish in general. Using Fib Lines we have profit zones between 6 and 28 percent. Price closed below the Low T-Line then printed a Bullish Engulf back in November.
Today At 9:10 AM ET. We will demonstrate live how you could be traded using our Simple Proven Swing Trade Tools
►Hit and Run Candlesticks Tool Box
Candlesticks • Price Action T-Line • T-Line Bands • Support • Resistance • Trendlines • Chart Patterns • Buy Box • Volatility Stops • Profit Zones • Entry Zones • Protective Stops • RBB Rounded Bottom Breakout Strategy • Pop Out of The Box Strategy • Pinball Strategy • Continuation Patterns • Trade Planning
[button_2 align=”center” href=”https://hitandruncandlesticks.com/hrc-rwo-30-day-offer/” new_window=”Y”]Learn The Tools In Our Tool Box 30-Day Trial[/button_2]► Learn the Power (SGRY)
On December 12, we shared, in detail, the technical chart properties of SGRY in our members Trading Room and why we thought this chart was ready for a profitable run. Yesterday the profits would have been about 60.5% or $590.00 with 100 shares. Using our Simple, Proven Swing Trade Tools and techniques to achieve swing trade profits. (See Above)
► Eyes On The Market
As long as price closes above the Lower T-Line Band and the V-Stop we will remain bullish. A price candle requires confirmation of 2 to 3 candles. The last ten days in the SPY we have seen a steeper than normal drive higher causing a bit of exhaustion and sellers to wake up. A close below $274.40 would show the sellers outnumber the buyers, a close below $272.55 would suggest the sellers plan to test the December Highs.
The VXX short-term futures have presented us with a weekly Bullish Borning Star and a daily close over the Upper bullish T-Line Band and has turned the V-Stop from red to green.
Rick’s Swing Trade ideas – MEMBERS remember to log into the members’ blog for the trade ideas – Member Login
30-Day Trial • Monthly • Quarterly • Semi-Annual • Annual
Candlesticks • Price Action T-Line • T-Line Bands • Support • Resistance • Trendlines • Chart Patterns • Buy Box • Volatility Stops • Profit Zones • Entry Zones • Protective Stops • RBB Rounded Bottom Breakout Strategy • Pop Out of The Box Strategy • Pinball Strategy • Continuation Patterns
Investing and Trading involves significant financial risk and is not suitable for everyone. No communication from Hit and Run Candlesticks Inc. is financial or trading advice. All information is intended for Educational Purposes Only. Terms of Service.
Rick Saddler is not a licensed financial adviser nor does he offer trade recommendations or advice to anyone except for the trading desk of Hit and Run Candlesticks Inc.
*************************************************************************************


Comments are closed.