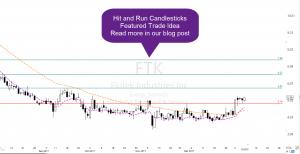
Rounded Bottom Breakout POOTB Strategy
 FTK has been in a downtrend that seems to have hit bottom on November 8, 2017. A Bullish piercing candle started the bullish price action that has lead to constructing a Bullish Bottom. Price broke out above the 50-SMA creating an RBB strategy, and the recent price action is now creating a Pop Out of The Box strategy as well. To learn more about the “RBB” and the “POOTB” visit us in the trading room.
At 9:10 AM ET. We will demonstrate how FTK was chosen using our Simple Proven Swing Trade Strategies
►Simple Proven Swing Trade Tools
Candlesticks • Price Action T-Line • T-Line Bands • Support • Resistance • Trendlines • Chart Patterns • Buy Box • Volatility Stops • Profit Zones • Entry Zones • Protective Stops • RBB Rounded Bottom Breakout Strategy • Pop Out of The Box Strategy • Pinball Strategy • Continuation Patterns
► Learn From The Chart (ALDR)
On December 26, we shared, in detail, the technical chart properties of ALDR in our members Trading Room and why we thought this chart was ready for a run. Yesterday the profits would have been about 30.47% or $350.00 with 100 shares. Using our simple, proven Swing Trade tools and techniques to achieve swing trade profits.
► Eyes On The Market
The S&-500 closed at another new high yesterday candlesticks stacking higher and higher. I was asked yesterday if the market is getting oversold? I replied “yes,” and I think all investors think the same thing. One person said oversold to what? True oversold compared to what? Then I said maybe the best way to look at this market is to follow the trend, the trend is not predictive it is what it is, and when the price falls out of the trend, you will know. Oversold/overbought indicators promo is guessing and predictions. Price action in or out of the trend is crystal clear.
The VXX short-term futures follow the trend, not much to talk about until price action can close above the “Lower T-Line Band”
Rick’s Swing Trade ideas – MEMBERS remember to log into the members’ blog for the trade ideas – Member Login
30-Day Trial • Monthly • Quarterly • Semi-Annual • Annual
Candlesticks • Price Action T-Line • T-Line Bands • Support • Resistance • Trendlines • Chart Patterns • Buy Box • Volatility Stops • Profit Zones • Entry Zones • Protective Stops • RBB Rounded Bottom Breakout Strategy • Pop Out of The Box Strategy • Pinball Strategy • Continuation Patterns
Investing and Trading involves significant financial risk and is not suitable for everyone. No communication from Hit and Run Candlesticks Inc. is financial or trading advice. All information is intended for Educational Purposes Only. Terms of Service.
Rick Saddler is not a licensed financial adviser nor does he offer trade recommendations or advice to anyone except for the trading desk of Hit and Run Candlesticks Inc.
*************************************************************************************


Comments are closed.