Bullish Engulf | POOTB
Hit and Run Candlesticks Members ► Log into the Members Blog for complete blog post with trade ideas | Log In
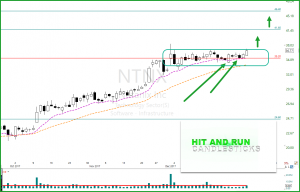
 NTNX – The buyers of NTNX created a Bullish Engulf on December 26 after a bullish run and a pullback. The Bullish Engulf followed by a (POOTB) Pop Out of The Box Pattern. The T-Line family has continued to trend higher proving the strength of the price action and commitment by the buyers. Several profit zones are available with a continued bullish trend.
At 9:10 AM ET. We will talk about the technical properties of NTNX with target zones, a couple of logical entries and a protective stop. We will also be showing our trade plan with risk/reward and expected profits.
► Must Read Trade Update (INSY)
[button_2 color=”light-green” align=”center” href=”https://hitandruncandlesticks.com/hrc-rwo-30-day-offer/” new_window=”Y”]30-Day Trial • Cancel Anytime • No Auto Billing[/button_2]On December 14, we shared, in detail, the technical chart properties of INSY in the Trading Room why we thought this chart was ready for a run. Yesterday the profits were about 113% or $710.00. Using simple rules and techniques to achieve swing trade profits. A traders lifestyle is worth the work.
Learn how and what we trade: The T-Line • T-Line Bands • Chart Patterns • Support • Resistance • Patterns • Buy Box • Volatility Stops • Price Action • Candlesticks • Profit Zones • Entry Zones • Protective Stops • RBB Pattern • Pop Out of The Box Pattern
► Eyes On The Market
Thr Bulls have worked that charts very well the first two trading days of 2018, and I suspect today will be the same. We may all get to ware our 25K tee-shirt for the DOW reaching a milestone after today. So let’s all think positive. The SPY (ETF for the S&P-500) has been lightly bouncing off the T-Line Low reaching and holding on to higher highs. The Lower T-Line is a moving average that we use for a moving trend line of the Candlesticks (price action lows).
The VXX short-term futures hit a new low yesterday after trying to climb over the Lower T-Line only to fail.
Rick’s Swing Trade ideas – MEMBERS ONLY
30-Day Trial • Monthly • Quarterly • Semi-Annual • Annual
Learn how and what we trade: The T-Line • T-Line Bands • Chart Patterns • Support • Resistance • Patterns • Buy Box • Volatility Stops • Price Action • Candlesticks • Profit Zones • Entry Zones • Protective Stops • RBB Pattern • Pop Out of The Box Pattern
Investing and Trading involves significant financial risk and is not suitable for everyone. No communication from Hit and Run Candlesticks Inc. is financial or trading advice. All information is intended for Educational Purposes Only. Terms of Service.
Rick Saddler is not a licensed financial adviser nor does he offer trade recommendations or advice to anyone except for the trading desk of Hit and Run Candlesticks Inc.
*************************************************************************************


Comments are closed.