Rick’s Featured Trade Ideas
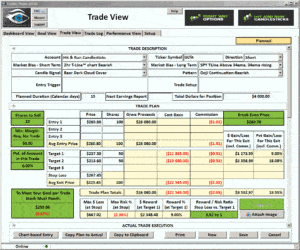
Today’s featured trade idea and my personal trade plan
ULTA | Piercing | Doji Continuation
Double click the trade plan to enlarge
The T-Line™ is a powerful timing indicator!
The close Friday suggested a little weakness in the SPY, but then again, after two Shooting Stars that formed a double top, what should we expect? Near-term support looks to be about $215.35 and resistance about $217.95. A close below $215.35 could send price to about $214.25, which is the 50-sma and the low of August 4, 2016. The buyers need to come out of the woodwork and find the north side of $217.95 sooner rather than later; otherwise, the sellers will grow in numbers. The VIX (VIX-X) has put together an impressive bottoming chart pattern, a little follow-though and price could be back to its 200-sma..
All the best to your trading success!
Rick | Hit and Run Candlestick Team
Trading knowledge ignites successful stock trading.
————————————————-
Members Daily Trade Ideas,
Reserved for member only – How about a 30-day $14.00 membership to try us out? Click Here
These are the stocks I put on my watch list to trade. I focus on these stocks for Swing Trades and the potential 10% – 40% gains. You must follow your trading rules for entry stops, profits or loses. Remember to check for earnings!
Keep your eye on the inverse ETF’s They trade well!
Based on the close yesterday | Watch for the change
SPY: T-Line™ & 2-hour chart | Seller control
IWM: T-Line™ & 2-hour chart | Seller control
SMH: T-Line™ & 2-hour chart | Buyer control for now
IYT: T-Line™ & 2-hour chart | Seller control
DIA: T-Line™ & 2-hour chart |Seller control
USO: T-Line™ & 2-hour chart | Bullish above 10.80, below not so much
UUP: T-Line™ & 2-hour chart | Bullish, resistance about 24.75
VIX: T-Line™ & 2-hour chart |Over 14.50 not so good for the bulls
Investing and Trading involves significant financial risk and is not suitable for everyone. No communication or chat sessions should be considered as financial or trading advice. All information is intended for Educational Purposes Only.
VXX S&P 500 VIX Short Term Futures: A close above the T-Line ™ implies the bullish short-term swing traders are in control. A close below the T-Line ™ implies the bearish short-term swing traders are in control.
Energy Sector: XLE, SX90, ERX, USO A close above the T-Line ™ implies the bullish short-term swing traders are in control. A close below the T-Line ™ implies the bearish short-term swing traders are in control.
SMH: A close above the T-Line ™ implies the above short-term swing traders are in control. A close below the T-Line ™ implies the bearish short-term swing traders are in control.
IYT: A close above the T-Line ™ implies the above short-term bullish swing traders are in control. A close below the T-Line ™ implies the bearish short-term swing traders are in control.
US Dollar Index: UUP, DXYO A close above the T-Line ™ implies the bullish short-term swing traders are in control. A close below the T-Line ™ implies the bearish short-term swing traders are in control. Learn more about the T-Line – Click Here
The information in this email and Blog Post are notes to myself and should NOT be construed as financial or trading advice.
Investing and Trading involves significant financial risk. No communication should be construed as financial or trading advice. All information provided is for Educational Purposes Only.
Investing and Trading involves significant financial risk and is not suitable for everyone. No communication or chat sessions should be considered as financial or trading advice. All information is intended for Educational Purposes Only.
http://hitandruncandlesticks.com Trading for Profit is not an investment advisory service, nor a registered investment advisor or broker-dealer and does not tell or suggest which securities or currencies customers or subscriber should buy or sell. The analysts and employees or affiliates of Company may hold positions in the stocks, currencies or industries discussed here.


Comments are closed.