You’ve lit dozens of candles over the years, I’ll bet: birthday candles on top of frosted cakes, scented candles to mask unpleasant odors, decorative candles during the holidays, and maybe even purely utilitarian candles when your electricity was out and you couldn’t find a flashlight. Picture the shape of a candle in your head. There’s the body, which is typically cylindrical in shape (boxy from the side), and there is a slender wick, which extends from the top. Keep that basic shape in mind, because today we’re learning how to read a candlestick chart.
How to Read a Candlestick Chart

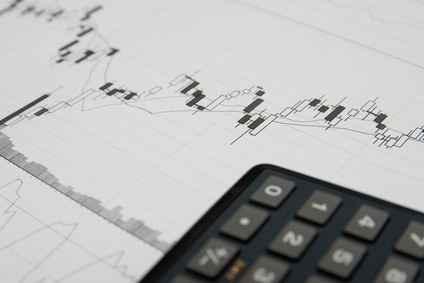
Japanese candlesticks, which are used to chart data, come in many different shapes and sizes. Some are all body and some are all wick, but let’s start by looking at the basic formation of a candlestick. A candlestick typically has a boxy center, known as the body, which can either be filled (black) or hollow (white). The body displays the open and close values of a specific time period. Filled bodies are used when the stock closes lower than its opening price, and hollow bodies are used when the stock closes higher than its opening price.
Two thin lines extend vertically from the body, one from the top and one from the bottom. These lines are called wicks (or sometimes “shadows” or “tails”), and they represent the high and low values of the time period.
So if you’re looking at a filled candlestick, the top of the higher wick represents the high, the top of the body represents the open, the bottom of the body represents the close, and the bottom of the lower wick represents the low. A filled candlestick indicates selling pressure. For a hollow-bodied candlestick, the body is flipped: the top of the higher wick represents the high, the top of the body represents the close, the bottom of the body represents the open, and the bottom of the lower wick represents the low. A hollow candlestick conveys buying pressure.
Here are some other handy things to know about candlestick charts:
- Long candlesticks indicate higher pressure (whether that is buying or selling pressure). Short candlesticks have less pressure.
- Marubozu candlesticks don’t have wicks (they are formed of bodies only). In a hollow Marubozu, the open equals the low and the close equals the high. In a filled Marubozu, the open equals the high and the close equals the low.
- Doji candlesticks don’t have bodies. They form when the open and close are virtually equal. Since they lack bodies, they often look like plus signs or crosses.
Many traders find Japanese candlestick charts to be more visually appealing and effective than other investing charts. They’re also easier to read. With a quick glance, you can compare the high-low relationship as well as the open-close relationship of a specific time period. When you begin to recognize candlestick patterns and positions, you’ll be better able to analyze the market and make predictions for the future. Good luck!
If you’re interested in mastering some simple but effective swing trading strategies using Japanese candlesticks, be sure to check out Hit & Run Candlesticks. Our methods are simple, yet powerful. We look for stocks positioned to make an unusually large percentage move, using high percentage profit patterns as well as powerful Japanese candlesticks.


Comments are closed.