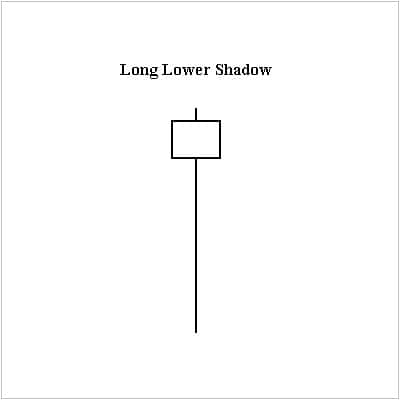
Even if they don’t have Peter Pan’s sly and scheming shadow, you can learn a lot about someone’s shadow from its size and shape: the position of the sun, the time of day, the person’s body position, the surrounding sources of light, and more. In the world of Japanese candlesticks, shadows go by several different names, including tails and wicks, but whichever term you prefer, it is important to understand the significance of a long lower tail. So today, we’re exploring a very simple signal: the Long Lower Shadow candlestick. Whether on its own or acting as a part of a larger pattern, this signal can help you understand many other candlesticks.
Long Lower Shadow Candlestick
Before we dig into Long Lower Shadow candlesticks, let’s review how candlestick shadows/tails/wicks work. The body of a candle stretches to convey the interval’s opening price and closing price. The shadows, on the other hand, show the highest price and the lowest price of the interval. So when examining a candle with a long lower shadow, the tail represents the interval’s low.
- If a bearish candle has a long tail, you can see a great discrepancy between the closing price and the interval’s low.
- If a bullish candle has a long tail, you can see a great discrepancy between the opening price and the interval’s low.
Formation
As this is a one-candle signal, the Long Lower Shadow candlestick is exceedingly simple to spot. However, it is still important to learn about the signal’s criteria to ensure that you aren’t mistaken when you think you have detected it. Look for the following characteristics:
First, a candlestick appears (surprise, surprise . . .). This candle can be white (or green) or black (or red). Second, that candlestick must have a long lower tail. To be more specific, the lower shadow should comprise two-thirds or more of the total range of the candlestick (from the top of the upper shadow to the bottom of the lower shadow).
Meaning
If the candle is bullish (white or green), the price dips down quite low following the interval’s opening due to the bears’ influence. However, the bulls gain control and push the price back up again, so the interval closes above where it began.
If the candle is bearish (black or red), the bears take the reins and force the price downward. After they’ve done all they can, they experience a pushback. The bulls take over and propel the price back up so the interval’s close is relatively far above the overall low.
The Long Lower Shadow candlestick is typically considered to be a bullish signal, but it is quite weak in this capacity. In addition, when the market is oversold or at support, the Long Lower Shadow candlestick tends to be more significant.
_____
Although the Long Lower Shadow candlestick doesn’t have a lot to say on its own, it should still be included in the larger conversation. When you spot it, look for surrounding candlestick patterns of which it may be a part. Good luck!
If you’re interested in mastering some simple but effective swing trading strategies, check out Hit & Run Candlesticks. Our methods are simple, yet powerful. We look for stocks positioned to make an unusually large percentage move, using high percentage profit patterns as well as powerful Japanese Candlesticks. Our services include coaching with experienced swing traders, training clinics, and daily trading ideas. To sign up for a membership, please click here.


Comments are closed.