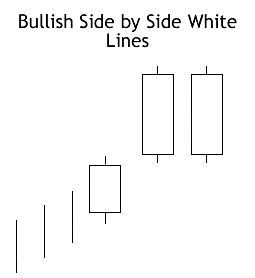
The Side by Side White Lines candlestick pattern contains twins: two candles of the same color and height standing side by side. Although visually consistent and uniform, this duo actually represents a struggle. The market opened at the same price two days in a row and closed at the same price two days in a row. Why can’t the bears successfully squash the uptrend? To better understand the shape and significance of the Bullish Side by Side White Lines pattern, keep reading.
Bullish Side by Side White Lines
Formation
The Bullish Side by Side White Lines candlestick pattern (say that three times fast!) consists of three candles: the opening candle and the twins we mentioned above. More specifically, you need to keep an eye out for the following criteria:
First, an uptrend must be in progress. Second, a white (or green) candle must appear, continuing the upward price trend. Third, two more white (or green) candles should appear above the body of the first candle (with a gap up between the first and second candle). The bodies of the second and third candles should be a similar size, and they must open and close at the same price (more or less).
NOTE: Although known as the Bullish Side by Side White Lines, remember that the colors white and green can be used interchangeably to convey that a candle is bullish.
A related pattern, the Bearish Side by Side White Lines, occurs during a downtrend and contains a small black candle followed by twin white candles. It signifies the continuation of the downward price trend.
Meaning
So what are the Side by Side White Lines trying to say? An uptrend is in progress, and the bulls are pushing the price steadily upward. On the second day, the upsurge is so significant, there is a gap up to where the candlestick opens. However, the bears have had enough with this uptrend. Fed up with the price escalation, they muster the energy to push the price down, so that the third candlestick opens at the same place the second candlestick opened. Their control is short lived, because the third candlestick stretches upward. Although the bears have attempted to turn the trend around, they have speedily lost to the bulls.
Typically, Bullish Side by Side White Lines indicate a continuation of the current upward price trend. The taller the twin candles, the stronger the pattern.
_____
Though obscure, the Bullish Side by Side White Lines pattern is a strong bullish indicator with a clear meaning. Before reacting to it, look for confirmation to verify that the uptrend is soldiering on despite the bears’ attempt at reversal. You can confirm the signal with a white candle, an upward gap, or a higher close.
If you’re interested in mastering some simple but effective swing trading strategies, check out Hit & Run Candlesticks. Our methods are simple, yet powerful. We look for stocks positioned to make an unusually large percentage move, using high percentage profit patterns as well as powerful Japanese Candlesticks. Our services include coaching with experienced swing traders, training clinics, and daily trading ideas. To sign up for a membership, please click here.


Comments are closed.