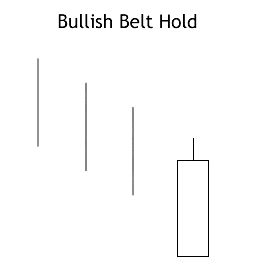
Although I can’t be sure, I like to imagine that the name of the Bullish Belt Hold candlestick was created as a metaphor for the relationship between a pair of pants and a belt. During a trading session, the price is continuing to fall downward (like a pair of pants), but the presence of a Bullish Belt Hold (a belt) signals that the price (the pants) will be pulled back up. If nothing else, it’s a helpful mnemonic device! If you’re interested in learning more about this bullish candlestick pattern, simply scroll down. We can help you identify it, interpret it, and confirm its significance.
Bullish Belthold Candlestick
Formation
Known as yorikiri in Japanese, the Bullish Belt Hold candlestick is formed of just a single candle and it has the potential to be a bottom reversal pattern. Like the Marubozu candlestick, the bulk of the candle’s meaning is found in its size because the wicks are either tiny or nonexistent.
Occurring after a downtrend, the Bullish Belt Hold isn’t difficult to spot and it’s also quite common. To identify it, look for the following criteria:
First, a downtrend must precede the candlestick. Second, after the stretch of bearish candlesticks, a bullish (white) candlestick must appear. Third, the pattern should be composed of a long white candlestick with a short upper shadow (or no upper shadow). Fourth, the candlestick should lack a lower shadow entirely. Fifth, the preceding downward trend may be further promoted by a gap open, and sometimes the gap is quite large.
There is also a Bearish Belt Hold signal, which, as you can imagine, is just the opposite of the Bullish Belt Hold. It is a single black candle that forms after an uptrend, but it also signals a potential reversal.
Meaning
The Bullish Belt Hold signal’s opening price is at the low of the trading session. During the session, however, the price rallies up and it closes at (or near) session highs, forming a white candlestick. The bottom of the candle represents the opening price, the top of the candle represents the closing price, and the top of the upper wick identifies the highest price of the day. The Bullish Belt Hold signal typically heralds a reversal in investor sentiment, showing a shift from bearish attitudes to bullish attitudes.
To better interpret a Bullish Belt Hold candlestick, look for the following characteristics:
- The longer the candle, the more powerful and significant the signal.
- To confirm the signal, the pattern should be followed by a bullish candlestick in the next session.
– – – – –
Although the Bullish Belt Hold signal appears quite often, it isn’t foolproof in predicting future prices, so be wary of trusting it during major trades. To ensure that you don’t make a risky move, remember to consider more than just a single trading session before making a bold move based on your prediction.
If you’re interested in mastering some simple but effective swing trading strategies, check out Hit & Run Candlesticks. Our methods are simple, yet powerful. We look for stocks positioned to make an unusually large percentage move, using high percentage profit patterns as well as powerful Japanese Candlesticks. Our services include coaching with experienced swing traders, training clinics, and daily trading ideas. To sign up for a membership, please click here.


Comments are closed.