Rick’s Featured Trade Ideas
Today’s featured trade idea and my personal trade plan
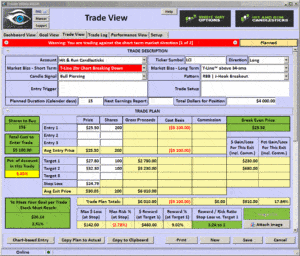
LCI/Long | RBB| Bullish J-Hook | Cup & Handle
 SPY: T-Line™ Chart: Needs confirmation
Good Morning, Profit Traders,
Yesterday the market went from an oversold low to a high with an impressive price action candlestick. The SPY in particular went from a low to a high with nearly a three point move in the candle pattern painting a bullish piercing candle and a candle in the belt-hold family. Here at Hit-And-Run Candlesticks and Right Way Options, we realize that price action/candlesticks require confirmation.
Despite the good price action yesterday, one would have thought that we could see a trend reversal in our intraday charts, but we did not. This should cause the savvy trader to have some concern or at least patience until we see the intraday charts with a bullish trend.
There are two major numbers that the Bulls need to capture: $209.36 and $210.15. This may not happen unless the intraday charts see a meaningful constructed bottom. Many times yesterday I pointed to a 30-minute chart and the fact that the T-Line™ was still below the 34 EMA. It would be a win for the Bulls if they could produce enough energy to drag the T-Line™ back above the 34-EMA; unless this happens, the bears stay in charge.
All the best to your trading success!
Rick | Hit and Run Candlestick Team
Trading knowledge ignites successful stock trading.
Continue Reading
Rick’s Featured Trade Ideas
Today’s featured trade idea and my personal trade plan
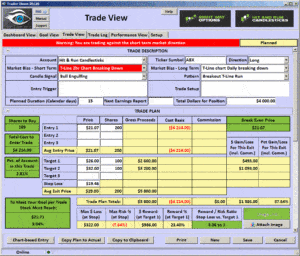
ABX/Long| T-Line ™ Bullish Trend | Recent break out | Bullish Engulf
SPY: T-Line™ Chart: Price breaking down on daily chart
Good Morning, Profit Traders,
The Shooting Star on the weekly chart of the SPY continues to suggest the sellers have control, and that if the bears take control today of the close, it looks like the $205.00 is on their minds.
On my three line T-Line™ chart price closed yesterday below the 34 EMA with the T-Line™ following close behind. The T-Line™ trend looks as if it’s ready to roll over and hang with the bears for a while.
Just something to think about, like 200-period moving average groupings are in the $202.00 area.
The top leading indexes for yesterday was Silver, Copper, Oil and Gas Drilling, and Gold.
As I’m looking through charts to trade for the next several days, silver, copper and gold stocks are really standing out. I’m seeing a lot of flags and flag breakouts, Morning Star signals and Bullish Engulfs all in bullish formation on my T-Line™ chart.
All the best to your trading success!
Rick | Hit and Run Candlestick Team
Trading knowledge ignites successful stock trading.
Continue Reading
Rick’s Featured Trade Ideas
No Featured trade idea today
SPY: T-Line™ 2-hr Chart sellers in control at the close yesterday
Good Morning, Profit Traders,
 Alaska Trading Cruise….Check it out
Yesterday’s low in the SPY, $206.92, came within eight cents of our $207.00 number that we have talked about. Yesterday’s gap down Doji close found support on our $207.00 support line with a Doji close back above the 50-day simple moving average. Other than the T-Line™ crossing below the 14-SMA, the T-Line™ trend chart is still in favor of the Bulls while the recent price action has been in favor of the bears. With the recent bear pullback on the daily chart, the weekly chart has been painting a bearish Shooting Star pattern. In the Hit-and-Run Candlesticks trading room, we have been very conservative and warning of caution. Right now we are in dangerous waters with uncertain wind changes, and let’s not forget about the sharks. The wind and the surf should quiet after Janet and the Brexit vote. Keep in mind that most of today’s price action will most likely be positioning and guessing on what Janet has to say and the Brexit vote. The technical trader doesn’t guess; the technical trader follows the charts for direction and insight.
All the best to your trading success!
Rick | Hit and Run Candlestick Team
Trading knowledge ignites successful stock trading.
Continue Reading
Rick’s Featured Trade Ideas
No Featured trade idea today
SPY: T-Line™ Chart: 2 and 4-hour chart breakdown | 15-min 200-FWsma has now broken below the other 2 deuces.
Good Morning, Profit Traders,
In yesterday’s morning note, I mentioned the numbers of $210.27, $209.15, $208.50 and $207.00, and that the bears have clobbered the first three lines and now they’re going after the $207.00 line. If the bears can manage to close price below $207.00, that would be below our T-Line™ grouping and will put a tremendous amount of pressure on the bulls. $205.00 is the next line for the bears to take over after $207.00.
On the bullish side, if the Bulls can circle the wagons and defend $207.00 with a follow-up bullish run, the overall bullish trend would remain intact. Once again, the $207.00 is in the spotlight.
In the trading room yesterday, I talked a lot about caution and about a brand-new ticker symbol, CIAP. You won’t find this ticker symbol on any chart; it’s a special ticker symbol that we use at Hit-And-Run Candlesticks to help members realize you don’t have to trade every day.
C-ash
I-s
A
P-osition
Because the market is so close to possibly jumping out of the window and so close to finding support and becoming a bullish monster, it is my feeling that we should wait patiently for a clue to the next leg. Therefore, there will be no featured trade idea or stock picks today; however, in the trading room, we will probably find something live that we can trade.
All the best to your trading success!
Rick | Hit and Run Candlestick Team
Trading knowledge ignites successful stock trading.
Continue Reading


