Rick’s Featured Trade Ideas
Today’s featured trade idea and my personal trade plan
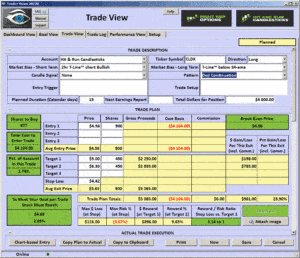
CLDX/Long |RBB| Doji Continuation
 SPY: T-Line™ T-Line is in a Bearish position with the 34-ema
Good Morning, Profit Traders,
Most everyone was headed out for vacation on Friday, so the overall commitment to trade was lackluster. The bulls were stopped at the sellers’ upper downtrend line drawn from June 8 to June 23 and extended downward to the July 1 high. There are now three touches on this downtrend line when you include July 1. (T-Line™ is also below the 34-ema. Last week was still a relief rally.) The futures are suggesting a bit of profit taking this morning after the Bulls’ impressive relief rally last week, so a little pullback would be healthy. $207.85 looks to be in a good pullback area followed by $206 40. If the bears can manage to push the Bulls back down to $206 40 and the Bulls lose confidence at that level, the 200-period moving average may be the fallback. Remember that price is king. Let’s always follow price. The relief rally last week was magnificent, and a pullback is likely but allow price to prove it — a bare minimum, a positive.
All the best to your trading success!
Rick | Hit and Run Candlestick Team
Trading knowledge ignites successful stock trading.
Continue Reading
Rick’s Featured Trade Ideas
Today’s featured trade idea and my personal trade plan
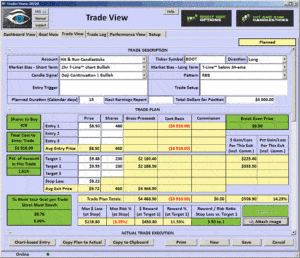
BOOT/Long |RBB| Doji Continuation
SPY: T-Line™ Chart Down | Price deep into resistance
 Good Morning, Profit Traders,
I was wrong! I never would’ve thought that the SPY would have gone from $198.55 to closing yesterday at $209 54 without at least a pausing pullback. All this week I have expected this relief rally to stop turn and head back down to at least find a higher low or a double bottom at the $198.55 level. It just goes to show you, keep your emotions and your forecasting out of the charts. Yes we have been approaching resistance and yes we are in resistance, but this week I did not follow my own advice….. FOLLOW PRICE ACTION, support and resistance is nothing unless price says it is. For some I think I may have to eat my hat today.
Yesterday’s close was on a bullish candle just underneath a two touch downtrend line, we are very overbought and we are very much in a resistance area. Let’s keep her eyes on the price watching the candlesticks for clues of more bullishness or selling.
All the best to your trading success!
Rick | Hit and Run Candlestick Team
Trading knowledge ignites successful stock trading.
Continue Reading
Inside out, upside down, backwards, forwards . . . Even when candlestick patterns go topsy-turvy, they have something to say about the state of the market. The Three Inside Up candlestick pattern is a reversal signal composed of a Bullish Harami pattern and a confirming third candle. To better understand this pattern (to turn it right-side out, you might say), scroll down to learn about its formation and meaning.
Continue Reading
Rick’s Featured Trade Ideas
Today’s featured trade idea and my personal trade plan
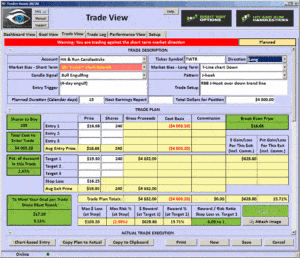
TWTR/Long |RBB| J-Hook| 4-day Engulf
SPY: T-Line™ Chart Down | Price deep into resistance
Good Morning, Profit Traders,
 $205.00 and $206.00 were both tagged briefly by two 30-minute bars. From there, the Bulls were able to find another $.90. On the 30-minute chart, the SPY is getting close to our high deuces which I’ll be discussing in the trading room today and the importance of where they are on the chart. A successful close over the high deuces would be a smooth move for the Bulls. Failure could produce a shorting opportunity. Today I see a little support on the SPY at $205.85 and a little resistance starting at $207.95.
The US dollar index (DXYO) has pulled back to support and is flagging. The question here is: Will support help push it through the 200-period moving average, or will the 200-period moving average be more than it can handle?
Overall, the market has been damaged and will take quality construction to put the market back in contention with the highs. It’s important to understand how bottoms are formed, how support needs to be tested and resistance needs to be broken down. There’s a big difference between a reversal and a relief rally. At this time, I only see a relief rally being attempted.
All the best to your trading success!
Rick | Hit and Run Candlestick Team
Trading knowledge ignites successful stock trading.
Continue Reading
 SPY: T-Line™ T-Line is in a Bearish position with the 34-ema


