Rick’s Featured Trade Ideas
Today’s featured trade idea and my personal trade plan
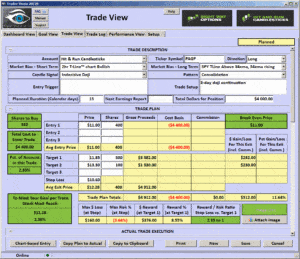
PAGP | Trending | 200-sma breakout | Doji Continuation
SPY: T-Line™ 34ema bullish trend | Market is getting very overbought
 Good Morning, Profit Traders,
Yesterday the SPY closed higher with a gap and a clear Doji and the trading range of the last 14 days has become extremely tight and narrow. The current chart pattern and yesterday’s Doji could lead to nothing more than minor consolidation and more bullishness.
If the Bulls lose 215.40 the bears should be able to pick up 212.40 Which would only be to the 23.6 fib line, a very healthy bullish pullback.
All the best to your trading success!
Rick | Hit and Run Candlestick Team
Trading knowledge ignites successful stock trading.
Continue Reading
Rick’s Featured Trade Ideas
Today’s featured trade idea and my personal trade plan
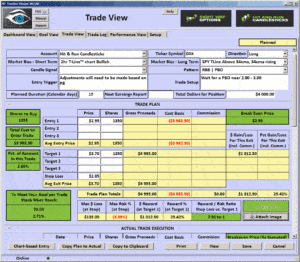
DSX | RBB | Bullish J-Hook Breakout
SPY: T-Line™ 34ema bullish trend | Market is getting very overbought
 Good Morning, Profit Traders,
Based on the open it would appear that the near dark cloud cover on IWM might not see weakness as follow through, of course the day is not completely over.
The morning futures seem to be suggesting that the Bulls are not willing to give up the race to the top. If the Bulls were to allow profits to be taken and it looks as if $212.00 down to $211.00 would be all the Bulls might give up.
You might want to draw from the June 24 high to yesterday’s high and then from the June 26 low to yesterday’s low you will see that there is a definite narrowing and tightening of range, this could be a warning sign of minor profit taking/consolidation.
All the best to your trading success!
Rick | Hit and Run Candlestick Team
Trading knowledge ignites successful stock trading.
Continue Reading
Who says three is crowd? With the right candlesticks in the right formation, three candles can signify a reversal in the market. Today we’re exploring the Three Inside Down candlestick pattern, which could also be described as a Bearish Harami with a third candle to confirm the signal’s intimation. Want to learn more about this simple but effective pattern? Scroll down to discover its formation and meaning.
Continue Reading
Rick’s Featured Trade Ideas
Today’s featured trade idea and my personal trade plan
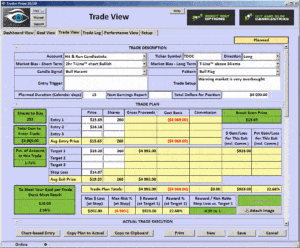
TDOC | Bull Flag | Bullish Harami
SPY: T-Line™ T-Line is in a Bullish position with the 34-ema (profit taking setting up)
 Good Morning, Profit Traders,
Another day, another dollar, and the SPY closed higher. There is no question that the SPY has entered overbought territory, and as of yesterday, no sell signal. We all know that price can continue to move higher in overbought conditions as well as move lower in oversold conditions. Being oversold or overbought is not a reason to buy a stock; on the other hand, price confirmation would be. And this is why the Hit-And-Run Candlesticks team is watching price action so closely for hints of: Not if a pullback signal is presented, but when a pullback signal is presented. If the signal happens this week, I would suspect possible support to be around $210.70.
All the best to your trading success!
Rick | Hit and Run Candlestick Team
Trading knowledge ignites successful stock trading.
Continue Reading
Rick’s Featured Trade Ideas
Today’s featured trade idea and my personal trade plan
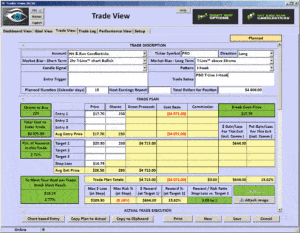
PRO| Bullish T-Line J-Hook
SPY: T-Line™ T-Line is in a Bullish position with the 34-ema (profit taking setting up)
 Good Morning, Profit Traders,
Once again the Bulls demonstrated their strength in the SPY by closing at $213.40, higher than the previous close after a four-day run bouncing off the 50-day simple moving average with a Doji continuation pattern. Yesterday, the SPY ended up with a candlestick Shooting Star signal. The Shooting Star signal I have found to be, at the very minimum, a warning sign. Combine that with yesterday’s narrow range in light volume, and it might be prudent not to blow off the warning. Price is also extremely overbought compared to the T-Line™, another warning sign that profit taking may be near, not to mention the four-week new high-low ratio is pegged in the overbought area.
Okay, enough of that talk. Candlestick signals require confirmation, and as of yesterday’s close, there is no confirmation that the bears are taking any kind of control on the daily chart; although the 2-hour chart is showing a confirmed Shooting Star signal. The trend is currently bullish with a strong possibility of a profit-taking pullback soon.
This week’s events – For more information Click Here
HRC Public webinar Tuesday July 12, 8pm EST
Trader Vision users group webinar Thursday July 14, 8pm CST
RWO Members Webinar Saturday July 16, 11am EST
All the best to your trading success!
Rick | Hit and Run Candlestick Team
Trading knowledge ignites successful stock trading.
Continue Reading


