Rick’s Featured Trade Ideas
Today’s featured trade idea and my personal trade plan
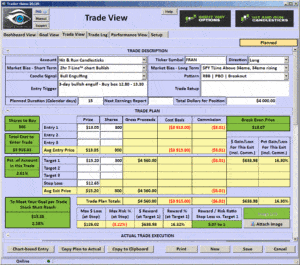
FRAN | PBO| RBB | Scoop
 Good Morning, Profit Traders,
The T-Line™ is a powerful timing indicator
After a pull back to the 20-sma last week, the bulls found support at $215.40 then shot past the $217.25 resistance line closing at $218.18, up $1.77.
Unless the bears step in hard, we are looking for the SPY to challenge $220.60. The 3-day chart on the SPY is presenting a T-Line™ Bullish Engulf PBO. The trend is always our friend, and pullbacks within a trend are good for the pocketbook. DIA, IWM, QQQ are also showing signs of bullishness.
All the best to your trading success!
Rick | Hit and Run Candlestick Team
Trading knowledge ignites successful stock trading.
Continue Reading
Rick’s Featured Trade Ideas
Today’s featured trade idea and my personal trade plan
No featured trade idea today
Good Morning, Profit Traders,
The T-Line™ is a powerful timing indicator
It’s all about the jobs report and how it is perceived. Yesterday, the SPY closed over the T-Line™ with a long lower wick suggesting the bulls may have decided to stop and take advantage of the bullish pullback. Below $215.25, the bulls lost interest and above $217.25 the Bears are in trouble. To really get this market moving, the DIA’s will have to close above $184.85.
All the best to your trading success!
Rick | Hit and Run Candlestick Team
Trading knowledge ignites successful stock trading.
Continue Reading
Rick’s Featured Trade Ideas
Today’s featured trade idea and my personal trade plan
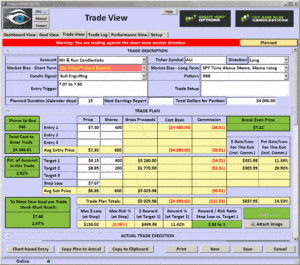
ALJ | RBB| Bullish Engulf | PBO bullish J-Hook
 Good Morning, Profit Traders,
The T-Line™ is a powerful timing indicator
On the daily chart the SPY formed a Bullish Harami above yesterday’s low unfortunately it did not close back above the T-Line™ as always candlestick signals must confirm but then again that’s true with price in general not just Candlesticks. If you look at yesterday’s Harami on an intraday chart (I am looking at a 1-hour and 2-hour chart) you can see a bear flag forming, this is why you need confirmation on the daily chart.
Be aware of QE from the Bank of England today and job numbers tomorrow, we should be prepared for anything in the market. Keep the watch lists for both long and short updated and handy.
All the best to your trading success!
Rick | Hit and Run Candlestick Team
Trading knowledge ignites successful stock trading.
Continue Reading
Rick’s Featured Trade Ideas
Today’s featured trade idea and my personal trade plan
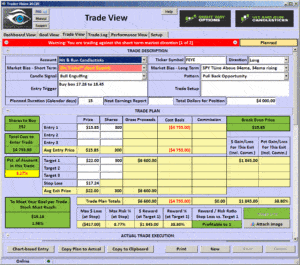
FEYE | PBO| Bullish Engulf
 Good Morning, Profit Traders,
The T-Line™ is a powerful timing indicator
The SPY has moved below the T-Line™ along with DIA, IWM, IYT and SMH. This is signaling the sellers are wanting there piece of the pie. Over all, the market is still bullish as long as we hold above support. The
profit taking pullback in the SPY, IWM, DIA is either testing the 23.6 Fib retracement (a bullish PBO so far). Friday’s job numbers may give the market a nudge one way or the other.
All the best to your trading success!
Rick | Hit and Run Candlestick Team
Trading knowledge ignites successful stock trading.
Continue Reading


